
US Airline On-Time League Table — 2 Months


Ready-to-run US airline on-time league table from official BTS data: two months of per-airline delay rates, cancellation causes and carrier vs weather vs late-aircraft delay minutes, with honest denominators on every row.

Input
Output fields
Sign up on Apify or log in
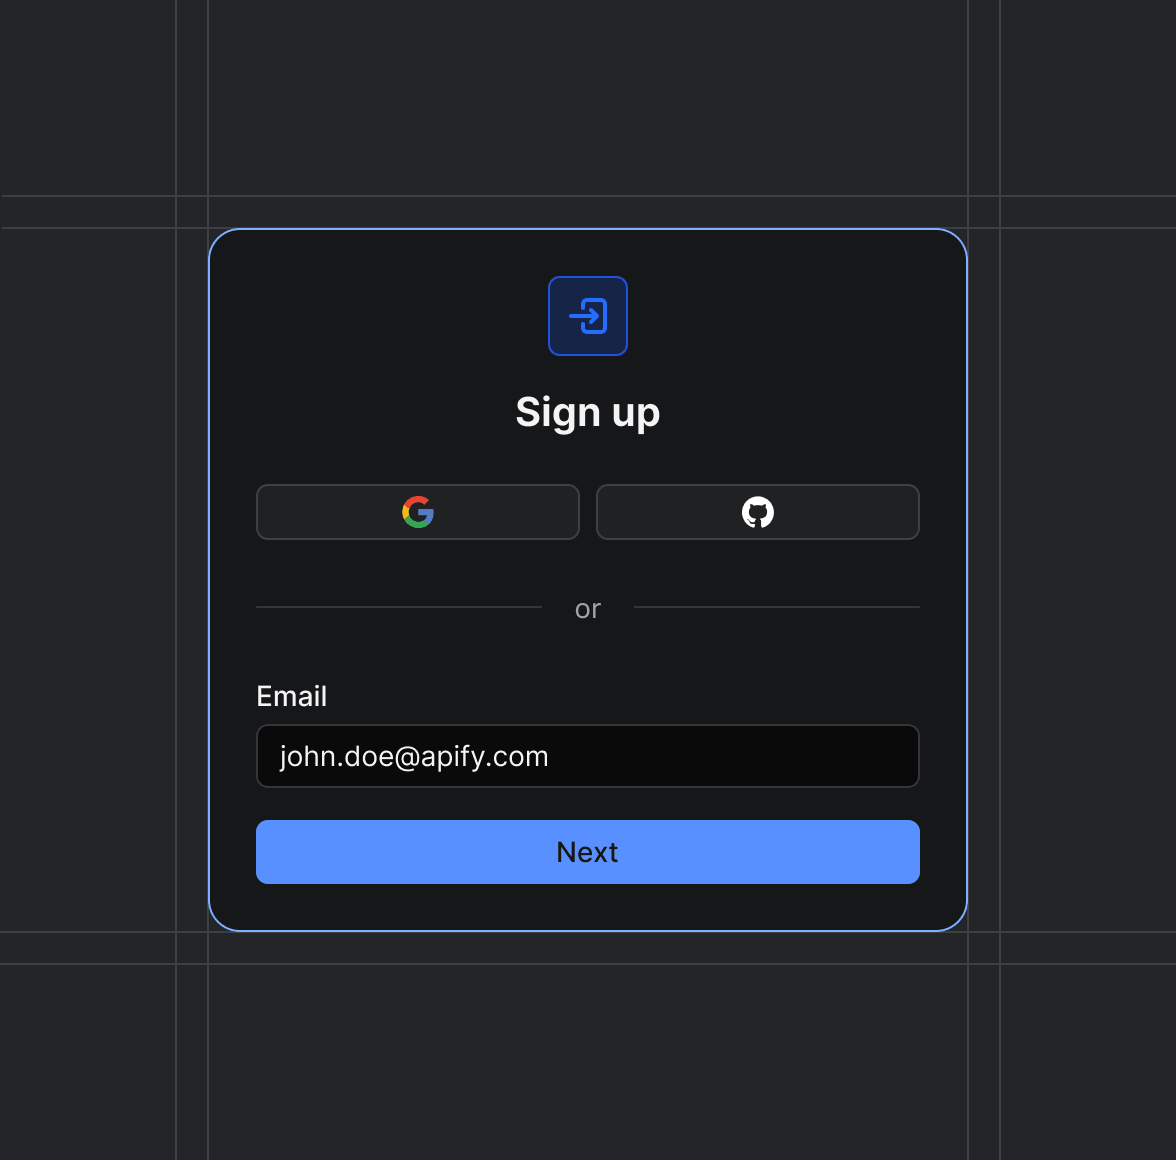
The US Airline On-Time & Flight Delay Statistics by Route (BTS) Actor is ready to run with the inputs already set for "US Airline On-Time League Table — 2 Months". Sign up or log in and you'll land in Apify Console with a copy of this exact task.
Start the "US Airline On-Time League Table — 2 Months" task
The US Airline On-Time & Flight Delay Statistics by Route (BTS) Actor will start running based on the input automatically. You can also change all the input fields, like first month (yyyy-mm), last month (yyyy-mm), and more, to match your specific use case.
Receive the "US Airline On-Time League Table — 2 Months" output
Monitor the progress in real time. You will be notified as soon as your dataset is complete and ready for review. Each result includes data such as month, airline, route, and more.
Integrate into your workflow
The final output is delivered in JSON, CSV, or Excel format, ready to be plugged into your workflow. You can also run the "US Airline On-Time League Table — 2 Months" task via API.
Integrate "US Airline On-Time League Table — 2 Months" into your workflow
Connect "US Airline On-Time League Table — 2 Months" with 100+ integrations, or run it via API or MCP.

Webhook

n8n

Make

Zapier

Airbyte

Keboola

IFTTT

Hubspot

GDrive

Gmail

Apify MCP

GitHub

Slack

LangChain

LlamaIndex

Flowise

Pinecone

OpenAI

Mastra

Clay