Go to example tasks
Tracking energy prices across a run of sitting days
Created by
丂卩ㄖㄖҜㄚ

Follow one term across a run of sitting days in both chambers, so you can see how often energy prices came up and who kept raising it.
Hansard Parliamentary Debatesspookyweb/uk-hansard-parliamentary-debates
Date
House
Debate
Speaker
+4 fieldsTextNumberBooleanListObject
Input
Chamber(required):both
Start Date(required):2026-01-12
End Date:2026-02-10
Search Term (Optional):energy prices
Maximum Days:30
Include Written Answers:true
Include Westminster Hall:true
Output fields
Date
House
Debate
Speaker
Party
Constituency
Words
Hansard
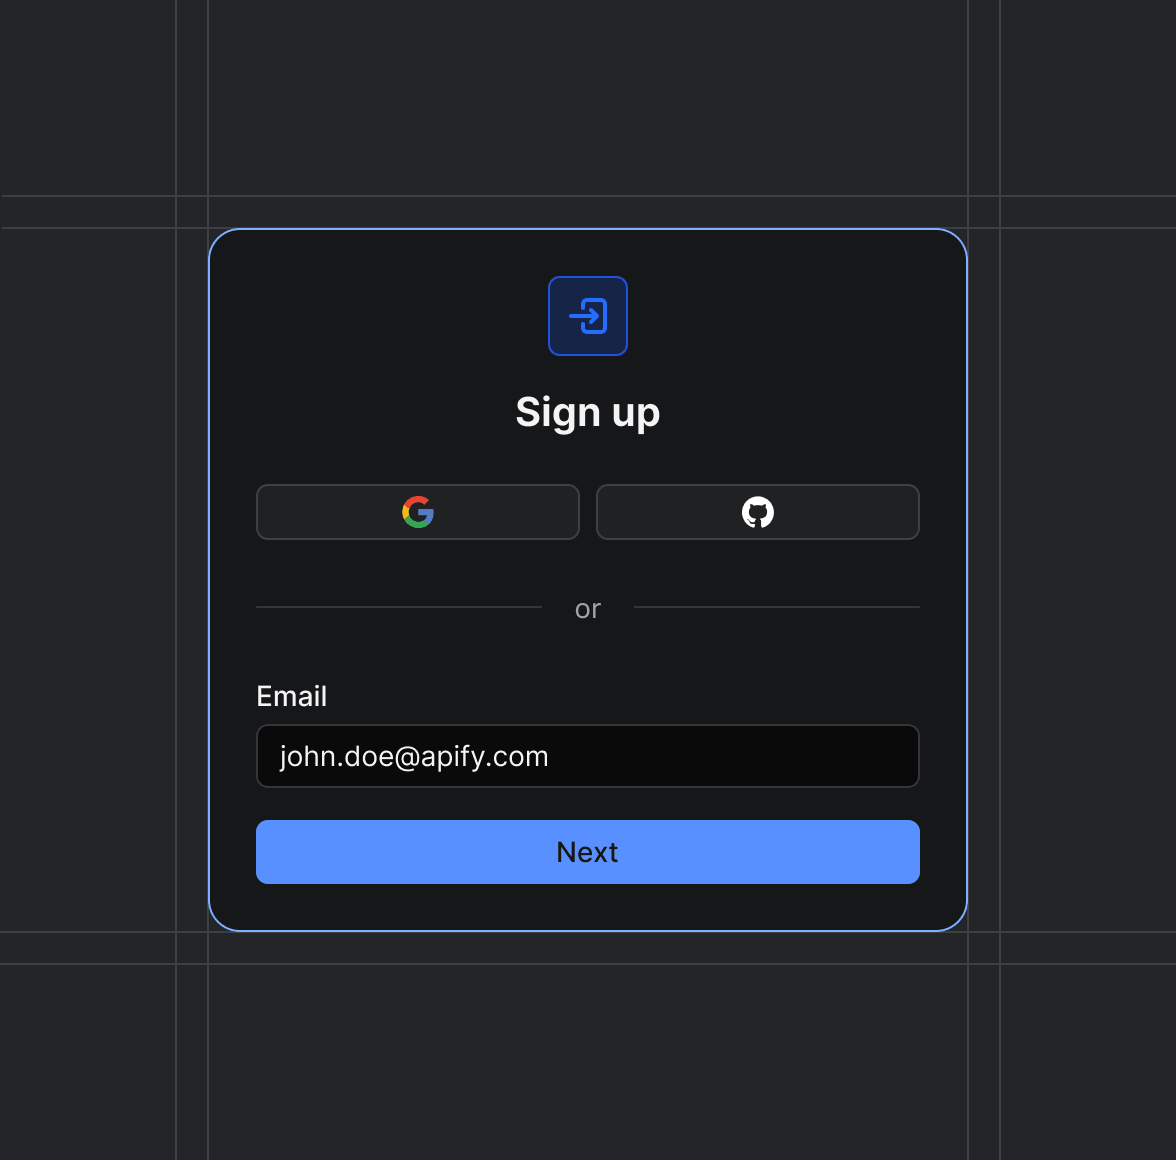
Sign up on Apify01
Create your Apify account to access the Hansard Parliamentary Debates.
Start the run02
The Actor will start running based on the input automatically.
Receive the output03
Monitor the progress in real-time. You will be notified as soon as your dataset is complete and ready for review.
Integrate into your workflow04
The final output is delivered in JSON, CSV, or Excel format, ready to be plugged into your workflow.