Website Uptime Checker
Pricing
Pay per event
Website Uptime Checker
This actor checks website uptime by making HTTP requests and measuring response times. It reports status codes, response times, content type, server headers, SSL validity, and redirect chains. Useful for monitoring website availability.
Pricing
Pay per event
Rating
0.0
(0)
Developer
Stas Persiianenko
Maintained by CommunityActor stats
0
Bookmarked
9
Total users
3
Monthly active users
a month ago
Last modified
Categories
Share
Check if websites are up and measure response times with status codes.
What does Website Uptime Checker do?
This actor checks website uptime by making HTTP requests and measuring response times. It reports status codes, response times, content type, server headers, SSL validity, and redirect chains. Feed it a list of URLs and get back structured data about whether each site is up, how fast it responds, and whether its SSL certificate is valid. Run it on a schedule to build a continuous uptime monitoring system with historical data.
Use cases
- Site reliability engineers -- monitor whether critical websites and services are up and responsive on an ongoing basis
- DevOps teams -- verify server headers, SSL certificates, and redirect behavior after deployments or infrastructure changes
- Marketing managers -- check that campaign landing pages are live and responding before launching paid ads
- Freelancers and agencies -- provide clients with uptime reports showing response times, status codes, and SSL status
- SEO professionals -- detect downtime or redirect issues that can hurt search rankings and crawl budgets
- E-commerce operators -- monitor storefront availability during peak traffic periods like sales events
Why use Website Uptime Checker?
- Batch processing -- check hundreds of URLs in a single run instead of pinging them one by one
- Comprehensive response data -- returns status code, response time, content type, server header, and SSL validity in one call
- Redirect tracking -- detects whether a URL redirected and reports the final destination URL and redirect status
- SSL monitoring -- validates SSL certificates so you can catch expirations before they cause browser warnings
- Structured JSON output -- consistent schema ready for dashboards, spreadsheets, and alerting pipelines
- API and schedule ready -- automate uptime checks via the Apify API or set up scheduled monitoring at any interval
- Pay-per-event pricing -- you only pay for the URLs you check, with tiered per-URL pricing that decreases at higher Apify plan tiers
Who is it for?
Website Uptime Checker is built for DevOps engineers, site reliability teams, SEO consultants, digital agencies, e-commerce operators, and founders who need lightweight uptime evidence without running a full monitoring stack. It is also useful for automation builders who want a simple Apify API endpoint that turns a list of URLs into structured status, latency, SSL, redirect, and header data.
Input parameters
| Parameter | Type | Required | Default | Description |
|---|---|---|---|---|
urls | array | Yes | -- | List of URLs to check uptime for |
Provide full URLs including the protocol (e.g., https://example.com). Each URL is checked independently with its own HTTP request and timing measurement.
Input example
Output example
Each result includes the URL, up/down status, status code, response time, content metadata, SSL validity, and redirect information.
How to check website uptime
- Open Website Uptime Checker on Apify.
- Enter one or more URLs in the
urlsfield. - Click Start and wait for the check to finish.
- Review status codes, response times, and SSL validity in the Dataset tab.
- Download results as JSON, CSV, or Excel.
- Optionally set up a recurring schedule for continuous monitoring.
How much does it cost to check website uptime?
Website Uptime Checker uses Apify's pay-per-event pricing model. You are only charged for what you use.
| Event | Price | Description |
|---|---|---|
| Start | $0.035 | One-time per run |
| URL checked | Tiered by Apify plan | Per URL checked; higher Apify plan tiers receive lower per-URL pricing |
Check the live Pricing tab on Apify for the current per-URL tier that applies to your Apify plan. The start fee stays fixed, while the per-URL event uses tiered pricing.
API usage
You can call Website Uptime Checker programmatically from any language using the Apify API. The actor slug is automation-lab/website-uptime-checker. Below are examples for common API clients.
Using the Apify API
The examples below show how to start a run, pass URLs, and fetch the output dataset after the run completes.
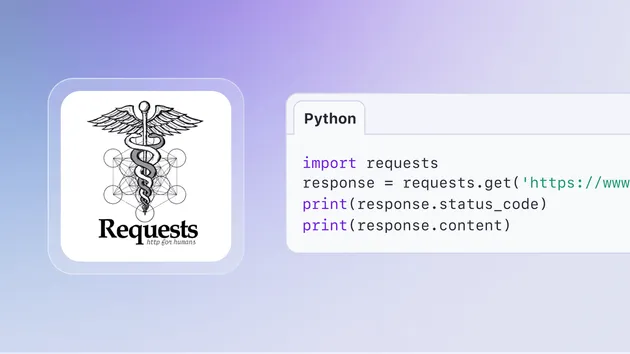
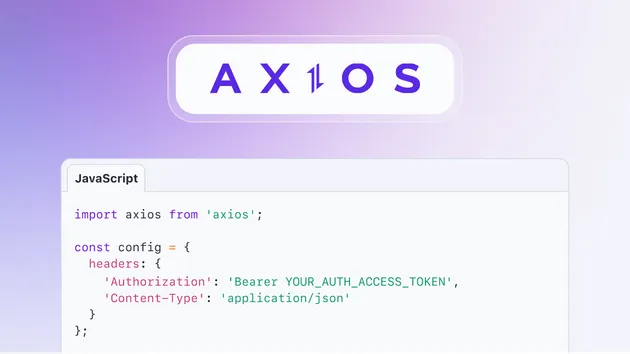
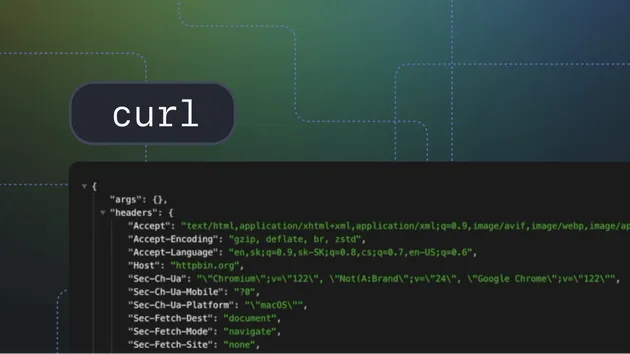
Node.js
Python
cURL
Use with Claude AI (MCP)
This actor is available as a tool in Claude AI through the Model Context Protocol (MCP). Add it to Claude Desktop, Cursor, Windsurf, or any MCP-compatible client.
Setup for Claude Code
Setup for Claude Desktop, Cursor, or VS Code
Add this to your MCP config file:
Example prompts
- "Is this website currently up: https://example.com?"
- "Check uptime status for these 20 domains"
- "Which of these sites are down right now and what error codes are they returning?"
Learn more in the Apify MCP documentation.
Integrations
Website Uptime Checker integrates with the major automation and data platforms through the Apify ecosystem:
- Make (formerly Integromat) -- trigger uptime checks on a schedule and send alerts when a site goes down.
- Zapier -- create Zaps that notify you via email, SMS, or PagerDuty when any monitored URL becomes unreachable.
- Google Sheets -- push results to a spreadsheet for historical uptime tracking and SLA reporting.
- Slack -- send notifications to a channel when
isUpreturns false so your team can respond immediately. - Webhooks -- feed results into your own monitoring dashboard or incident management system.
- n8n -- orchestrate runs from n8n workflows or any platform that supports HTTP requests and the Apify REST API.
Tips and best practices
- Schedule frequent checks -- set up an Apify schedule to run every 5-15 minutes for critical sites to catch downtime early.
- Monitor redirect chains -- unexpected redirects (e.g., to a parking page) can indicate domain expiration or DNS hijacking.
- Watch SSL validity -- the
sslValidfield flags expired or misconfigured certificates before they cause browser warnings for visitors. - Track response times -- export results to a spreadsheet over time to spot performance degradation trends and seasonal patterns.
- Pair with alerting -- combine with Slack or email webhooks to get instant notifications when any monitored URL goes down.
- Group URLs by priority -- run critical production URLs on a tight schedule (every 5 minutes) and less important pages on a longer cycle (hourly or daily).
How do I set up free website uptime monitoring?
Most uptime monitoring services charge $5-50/month for basic plans. With Website Uptime Checker on Apify's free plan, you can monitor websites at a fraction of the cost:
- Create an Apify account (free tier includes $5/month credits)
- Open Website Uptime Checker and enter your URLs
- Set up a schedule — run every 5, 15, or 60 minutes depending on how critical the site is
- Add a webhook — send alerts to Slack, Discord, email, or PagerDuty when a URL returns
isUp: false
At $0.001 per URL checked, you can monitor 10 URLs every 15 minutes for approximately $2.88/month — well within the free tier for light monitoring.
What is the difference between uptime monitoring and health checking?
Uptime monitoring answers a simple question: "Is this URL responding?" It checks HTTP status codes, response times, and SSL validity. It's fast (< 1 second per URL) and designed for frequent, lightweight checks.
Health checking goes deeper: it audits security headers, meta tags, DNS configuration, and page performance with a weighted scoring system. It takes 2-5 seconds per URL and is designed for periodic comprehensive audits.
Use Website Uptime Checker for continuous monitoring (every 5-15 minutes) to catch outages quickly. Use Website Health Report for weekly or monthly deep audits to track security and SEO health over time. Both tools complement each other.
How do I monitor SSL certificate expiration?
SSL certificate expiration is one of the most common causes of website downtime. When a certificate expires, browsers show security warnings that block visitors.
Website Uptime Checker reports sslValid: true/false for every URL. Set up a scheduled run and monitor the sslValid field — when it flips to false, your certificate has expired or is misconfigured.
For proactive monitoring before expiration, pair this with Website Health Report which reports the exact SSL expiry date and warns you when certificates are within 30 days of expiration.
Legality
Is it legal to check website uptime?
Yes. Website Uptime Checker sends standard HTTP requests to publicly accessible URLs — the same type of request any web browser makes. No authentication is bypassed, no private data is accessed, and no terms of service are violated.
Uptime monitoring is a standard practice used by millions of website operators, DevOps teams, and service providers. Commercial monitoring services like Pingdom, UptimeRobot, and StatusCake have operated in this space for years.
Key points:
- Only publicly accessible URLs are checked
- The tool sends standard HTTP requests, just like a browser
- No login credentials or private APIs are used
- Request frequency is configurable to avoid excessive load
For more details, see the Apify guide on ethical web scraping.
FAQ
Does this actor follow redirects?
Yes. If a URL redirects, the actor follows the chain and reports the final URL in the finalUrl field, along with redirected: true. The status code reflects the final response.
Can I monitor internal or private URLs? No. The actor runs on Apify's cloud infrastructure and can only reach publicly accessible URLs. For internal monitoring, you would need to deploy the actor on a self-hosted Apify instance with network access.
How is isUp determined?
A URL is considered "up" if the HTTP request completes successfully and returns a status code in the 2xx or 3xx range. Status codes 4xx and 5xx, timeouts, and connection errors result in isUp: false.
What timeout is used for requests?
The actor uses a reasonable default timeout for HTTP requests. If a server does not respond within the timeout window, the URL is marked as down with a timeout error in the error field.
Can I export results to CSV or Google Sheets? Yes. Apify datasets support export in JSON, CSV, Excel, XML, and other formats. You can download results from the Apify Console or use the API. For Google Sheets, use the built-in Apify integration or connect via Make or Zapier.
A site shows isUp: false but I can access it in my browser. Why?
The actor runs from Apify's cloud infrastructure. The site may be blocking requests from data center IP ranges, applying geographic restrictions, or requiring a browser (JavaScript challenge, CAPTCHA). Some sites also return 403 status codes to non-browser user agents. The error and statusCode fields will help identify the specific cause.
The response time seems very slow compared to my own experience. What is happening? Response time depends on the network path between Apify's servers and the target website. Geographic distance, CDN configuration, and server load all affect timing. The measurement reflects server response time from Apify's data center, not from your local network. For consistent monitoring, schedule regular runs and track trends rather than comparing to browser-based measurements.
Related actors
Other developer tools on Apify
- WHOIS Lookup -- look up domain registration data for any domain
- Website Health Report -- comprehensive website health audit with scoring
- Website Performance Checker -- measure TTFB, page size, and compression
- Website Change Monitor -- track web page content changes automatically