

Solar PV Yield Estimator (PVGIS)
Pricing
from $10.50 / 1,000 site estimates
Solar PV Yield Estimator (PVGIS)
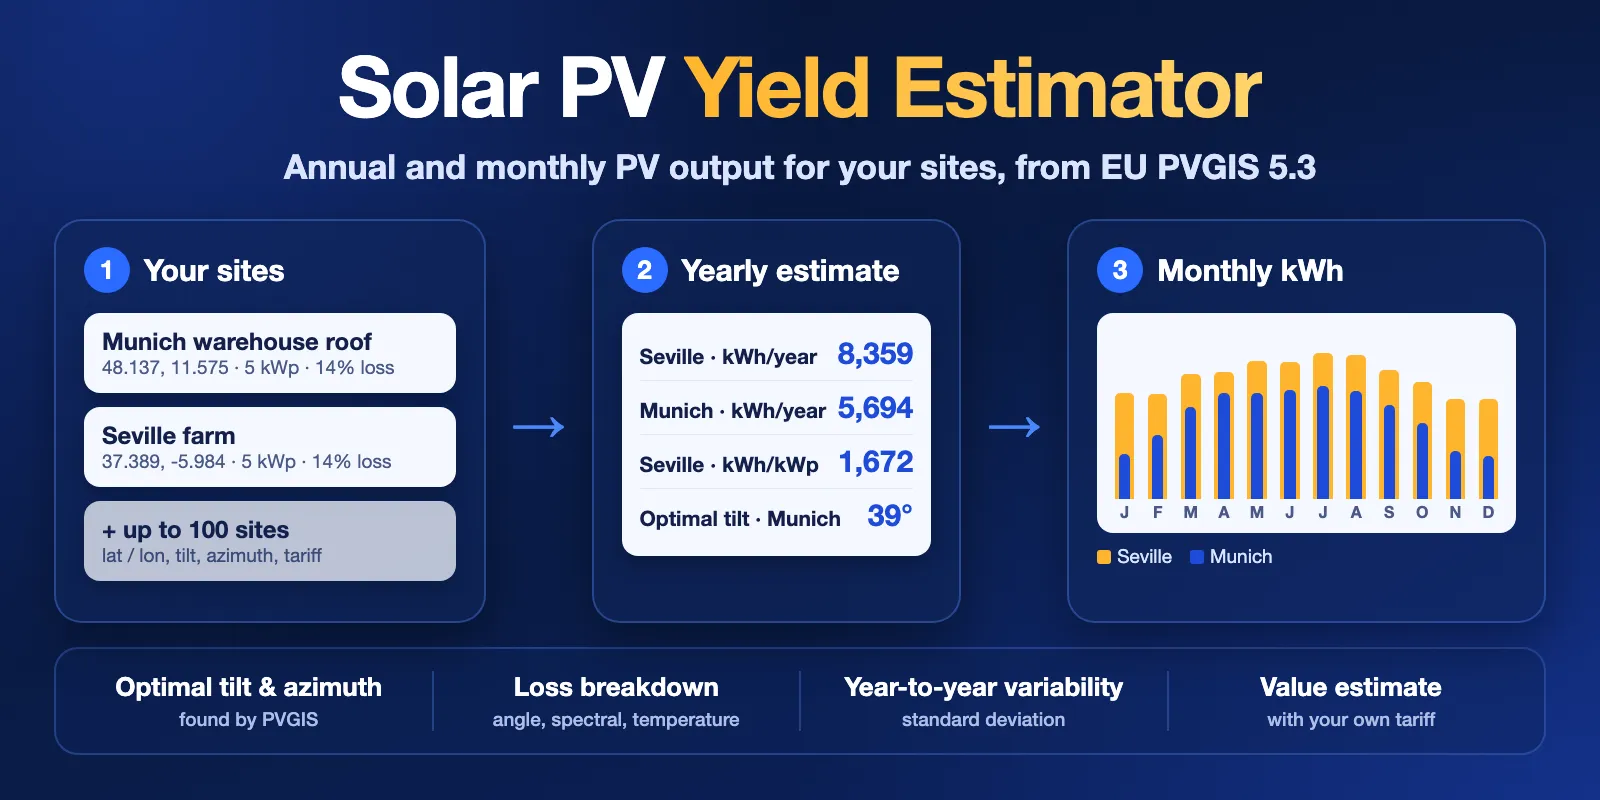
Estimate annual and monthly solar PV output for a list of sites with the official EU PVGIS v5.3 model: kWh/year, kWh/kWp, monthly kWh, optimal tilt and azimuth, loss breakdown, year-to-year variability and an optional value estimate.
Pricing
from $10.50 / 1,000 site estimates
Rating
0.0
(0)
Developer

Cliqto Media
Maintained by CommunityActor stats
0
Bookmarked
2
Total users
1
Monthly active users
5 days ago
Last modified
Categories
Security
Limited permissionsShare
Solar PV Yield Estimator (PVGIS) estimates how much electricity a solar PV system will produce at each site in your list, using the official EU PVGIS 5.3 model from the European Commission's Joint Research Centre. For every site you get kWh per year, kWh per kWp, kWh per month, the optimal tilt and azimuth, a loss breakdown, year-to-year variability and an optional value estimate with your own tariff.
It is made for solar installers, EPCs, consultants and energy analysts who need first yield figures for many sites without opening the PVGIS website for each one. No login and no API key are needed. The form example (a 5 kWp system in Munich and one in Seville) finishes in a few seconds and costs $0.036: $0.006 per run plus $0.015 per computed site.
Contents
- What it does
- Quick start
- Input
- Output
- Pricing
- Use cases
- API and integrations
- Limits
- Troubleshooting
- FAQ
- Data source and licence
- Support
What it does
The Actor sends each site to the public PVGIS 5.3 PVcalc API and turns the answer into one clean row per site.
- Yield per site.
annualEnergyKwh,specificYieldKwhPerKwp,averageDailyEnergyKwhand 12 monthly values (monthlyEnergyKwhandmonthlywith irradiation and standard deviation). - Optimal angles. Leave out the tilt and azimuth and PVGIS finds the best values for the site. Give only the azimuth (for example a fixed roof direction) and PVGIS finds the best tilt.
- Both azimuth conventions. Enter azimuths the PVGIS way (0 = south) or as a compass bearing (180 = south). Every row has both
azimuthDegandazimuthCompassDeg. - Quality figures. In-plane irradiation, performance ratio, angle-of-incidence, spectral and temperature losses, total loss and year-to-year variability.
- Value estimate. Add your own price per kWh and each site gets
estimatedAnnualValue. - Clear status. Each row is
complete,not_found(sea or outside the radiation data) orerror, with a reason. Invalid sites are reported and skipped; the rest of the list still runs.
The figures are PVGIS long-term averages for a grid-connected fixed system (2005–2023 for SARAH3). They are not a bankable yield report, a shading study, a roof check or a financial model.
Good fit
- Quick yield and kWh/kWp figures for a list of quotes or leads.
- Comparing orientations or tilts on the same site (one row per variant).
- Screening many locations for a solar portfolio.
- Feeding monthly kWh into your own sizing, self-consumption or ROI sheet.
Not a fit
- Roof detection, panel layout or near shading from buildings and trees. PVGIS only uses the terrain horizon.
- Trackers, off-grid systems with batteries, or hourly time series.
- Tariffs, feed-in rules, taxes, degradation or payback. The value estimate is only kWh × your price.
Quick start
- Open the Input tab.
- Keep the two example sites in
sites, or replace them with yours:lat,lonandpeakPowerKwfor each. - Keep Optimize missing angles on, or add
angleandazimuthto a site. - Click Start.
- Open the Output tab (Dataset) and check
annualEnergyKwhandspecificYieldKwhPerKwp.
Expected result: one row per site. For the form example, Munich gives about 5,694 kWh/year (1,139 kWh/kWp) and Seville about 8,359 kWh/year (1,672 kWh/kWp).
Input
Input fields
| Field | Form label | Type | Default | Allowed values | Effect |
|---|---|---|---|---|---|
sites | Sites | array, required | prefill: Munich and Seville, 5 kWp, 14% loss | 1–100 site objects | One estimate per site |
optimizeAngles | Optimize missing angles | boolean | true | true, false | Used when a site has no angle |
azimuthConvention | Azimuth convention | string | pvgis | pvgis (0 = south, -90 = east, 90 = west), compass (0 = north, 90 = east, 180 = south) | How azimuth in your sites is read |
radiationDatabase | Radiation database | string | auto | auto, PVGIS-SARAH3, PVGIS-ERA5 | Solar data PVGIS uses |
pvTechnology | PV module technology | string | crystSi | crystSi, CIS, CdTe, Unknown | Temperature and spectral corrections |
useHorizon | Include horizon shading | boolean | true | true, false | Shading from hills and mountains |
tariffPerKwh | Electricity value per kWh (optional) | number | empty | 0–100 | Adds estimatedAnnualValue |
currency | Currency code | string | EUR | 3-letter code | Label for the value estimate |
Site fields
| Field | Required | Default | Allowed values | Meaning |
|---|---|---|---|---|
lat | yes | — | -90 to 90 | Latitude in decimal degrees |
lon | yes | — | -180 to 180 | Longitude in decimal degrees |
name | no | Site 1, Site 2, … | text | Your label, copied to siteName |
peakPowerKw | no | 1 | above 0 | Installed peak power in kWp |
lossPercent | no | 14 | 0–99 | System losses: cables, inverter, dirt, mismatch |
angle | no | optimal or 0 | 0–90 | Tilt from horizontal |
azimuth | no | optimal or facing the equator | PVGIS: -180 to 180; compass: 0–360 | Orientation, read with azimuthConvention |
mounting | no | free | free, building | Free-standing rack or building-integrated (hotter modules) |
Duplicate sites are not merged: each one is computed and charged. A site with an invalid value (for example lat: 95) gets an error row with errorCode: INVALID_SITE, is not charged, and does not stop the other sites.
How angle settings work together
| Site has | optimizeAngles: true | optimizeAngles: false |
|---|---|---|
No angle, no azimuth | PVGIS finds both | Flat (0°) array facing the equator |
Only azimuth | PVGIS finds the best tilt for that direction | Flat (0°) array |
Only angle | Facing the equator at your tilt | Same |
| Both | Your values | Your values |
"Facing the equator" means south in the northern hemisphere and north in the southern one.
Input examples
Two sites with optimal angles (form example)
Expected output: 2 complete rows; Munich tilt 39°, compass azimuth 179°.
Fixed roof, compass bearing and a tariff
Expected output: 2 rows with your tilt and direction (tiltOptimized: false) and estimatedAnnualValue = annualEnergyKwh × 0.3.
Output
Each site gives one Dataset row. The run also writes RUN_SUMMARY to the default key-value store. The Output tab has three views: Overview (yield and angles), Monthly output (12 monthly kWh values) and Losses and data (loss figures, databases and provenance).
Output example
Trimmed: monthly shows 1 of 12 months.
Fields
| Field | Meaning |
|---|---|
siteIndex, siteName, input | Position in your list, your label and the site exactly as you sent it |
status, statusReason, errorCode | complete, not_found or error, with a plain reason and a code |
latitude, longitude, elevationM | Location; elevation comes from PVGIS |
peakPowerKw, systemLossPercent, mounting, pvTechnology | System used for the calculation |
tiltDeg, azimuthDeg, azimuthCompassDeg | Angles PVGIS used; azimuthDeg is PVGIS style (0 = south), azimuthCompassDeg is a compass bearing (180 = south). Both come from the angle PVGIS reports back, which can differ from your input by about 1° (for example, a south-hemisphere site facing north may come back as -179, compass 1) |
tiltOptimized, azimuthOptimized | true when PVGIS chose the value |
annualEnergyKwh, averageDailyEnergyKwh | Long-term average output, kWh per year and per day |
specificYieldKwhPerKwp | annualEnergyKwh ÷ peakPowerKw (computed by the Actor) |
annualIrradiationKwhPerM2 | Sunlight on the tilted panel plane per year |
performanceRatioPercent | Specific yield ÷ in-plane irradiation (computed by the Actor) |
annualEnergyStdDevKwh, annualVariabilityPercent | Year-to-year standard deviation, in kWh and as % of the average |
angleOfIncidenceLossPercent, spectralLossPercent, temperatureIrradianceLossPercent, totalLossPercent | PVGIS loss figures in %. Negative = loss, positive = gain. The total includes your lossPercent |
monthlyEnergyKwh | 12 numbers, January to December |
monthly | Per month: energy, daily energy, irradiation, daily irradiation and standard deviation |
tariffPerKwh, currency, estimatedAnnualValue | Only when you set tariffPerKwh; otherwise null |
radiationDatabase, meteoDatabase, dataYearsFrom, dataYearsTo | Data PVGIS used and the years it covers |
horizonUsed, horizonDatabase | Whether terrain shading was included |
pvgisVersion, sourceUrl, fetchedAt | Provenance: the exact PVGIS request and the time |
In not_found and error rows the yield fields are null, never 0. Example of a not_found row reason: PVGIS: Location over the sea. Please, select another location.
Run summary
RUN_SUMMARY in the key-value store has status (COMPLETE, PARTIAL, NOT_FOUND, CAPPED, ERROR, INVALID_INPUT or CANCELLED), a plain message, counts (sites, complete, notFound, invalidSites, errors, unprocessed, chargedSiteEstimates), totals (sum of annual kWh, kWp and value), request statistics, warnings, timing and the data source attribution.
Pricing
Pay per event. Platform usage is included.
| Event | Price | When |
|---|---|---|
| Actor start | $0.006 | Once per run |
| Site estimate | $0.015 | Each complete row (less on higher Apify plans, down to $0.0125) |
not_found, error and invalid rows are free. A run where no site is computed costs only the start.
| Run | Example cost |
|---|---|
| 2 sites (form example) | $0.036 |
| 10 sites | $0.156 |
| 100 sites (maximum) | $1.506 |
| All sites over the sea or invalid | $0.006 |
Set a maximum cost per run in the run options to cap your spend. The Actor checks the cap before each site, stops before a site that does not fit and reports CAPPED; the remaining sites get an error row with CHARGE_LIMIT_REACHED and are not charged.
Use cases
| Buyer job | Input | Key fields | Next step |
|---|---|---|---|
| Yield for a quote | 1 site with lat, lon, peakPowerKw | annualEnergyKwh, monthlyEnergyKwh | Copy into the offer |
| Compare roof directions | Same site twice, different azimuth and angle | annualEnergyKwh, specificYieldKwhPerKwp | Pick the better layout |
| Screen a site list | Up to 100 sites with name | specificYieldKwhPerKwp, status | Rank or filter in a sheet |
| Rough revenue | Sites + tariffPerKwh + currency | estimatedAnnualValue | Your own ROI model |
API and integrations
Start a run with the same JSON input through the Apify API (POST /v2/acts/cliqtomedia~solar-pv-yield-estimator/runs), then read the Dataset. Export to CSV, Excel, JSON or XML, or send rows to Google Sheets, a CRM or a webhook with Apify integrations. Join rows to your list on siteIndex or siteName. For CSV, use monthlyEnergyKwh for a simple 12-column monthly table.
Use with AI agents (MCP)
AI agents can call this Actor through the Apify MCP server: add https://mcp.apify.com?tools=cliqtomedia/solar-pv-yield-estimator to your MCP client (Claude, Cursor, VS Code and others). The MCP server needs your Apify account (OAuth sign-in or an Apify API token); PVGIS itself needs no key. The smallest useful input:
Key output fields for an agent: annualEnergyKwh, specificYieldKwhPerKwp, monthlyEnergyKwh, tiltDeg, azimuthCompassDeg, status, and RUN_SUMMARY.status. One site takes a few seconds and costs $0.021. sites holds at most 100 items.
Limits
- 1 to 100 sites per run. For longer lists, use several runs.
- Sites are computed 3 at a time; 100 sites took about 47 seconds in tests. The internal time budget is 240 seconds; sites left after that get
DEADLINE_REACHEDand are not charged. - Fixed (non-tracking), grid-connected systems only. Monthly and yearly averages only, no hourly series.
- PVGIS-SARAH3 covers Europe, Africa and parts of Asia and South America.
autofalls back to PVGIS-ERA5 elsewhere (in tests: New York, Tokyo, Sydney). Choosing a database that does not cover a site givesnot_found. - The terrain horizon includes hills and mountains, not nearby buildings or trees.
- If PVGIS fails 3 times in a row (outage, rate limit or timeout), the Actor stops calling it and marks the rest as not computed, so a source outage does not use up your run time.
Troubleshooting
| Symptom | Check | Action |
|---|---|---|
not_found, LOCATION_OVER_SEA | latitude, longitude | Check the coordinates are on land and lat/lon are not swapped. |
not_found, OUTSIDE_DATABASE_COVERAGE | radiationDatabase input | Use auto or PVGIS-ERA5. |
error, INVALID_SITE | statusReason | Fix the field named in the reason. |
INVALID_INPUT | RUN_SUMMARY.message | Add at least one site, keep sites at 100 or fewer, check tariffPerKwh and currency. |
CAPPED | RUN_SUMMARY.message | Raise the maximum cost per run, or run the remaining sites again. |
ERROR or SOURCE_UNAVAILABLE rows | RUN_SUMMARY.http.failures | PVGIS was down or slow. Run the failed sites again later. |
| Yield looks too low | tiltDeg, azimuthCompassDeg, lossPercent | Check the azimuth convention: in pvgis, 0 is south; in compass, 0 is north. |
FAQ
How accurate is this?
It is the same model as the PVGIS website, using long-term satellite or reanalysis data. The figures are averages: single years vary (see annualVariabilityPercent). Real systems also lose output to near shading, snow, soiling and equipment faults that PVGIS does not know about.
Is the result the same as on the PVGIS website?
Yes, for the same inputs. The Actor calls the PVGIS 5.3 API and keeps its values. Each row has sourceUrl so you can repeat the exact request.
What should I use for lossPercent?
PVGIS suggests 14% for a typical system. Use more for long cable runs, old inverters or dusty sites.
Do I need an API key?
No. PVGIS is free and open. You only need an Apify account.
Can I use it outside Europe?
Yes. With radiationDatabase: auto, sites outside SARAH3 use ERA5, which covers most other land areas. Test runs for New York, Tokyo and Sydney returned complete rows.
Data source and licence
Data: PVGIS 5.3, © European Union, European Commission, Joint Research Centre, reused under the Commission reuse policy (CC BY 4.0). The radiation data include PVGIS-SARAH3 (based on EUMETSAT CM SAF SARAH-3) and PVGIS-ERA5 (contains modified Copernicus Climate Change Service information). specificYieldKwhPerKwp, performanceRatioPercent, annualVariabilityPercent, azimuthCompassDeg and estimatedAnnualValue are computed by this Actor from PVGIS values. This Actor is not made, checked or endorsed by the European Commission or JRC.
Support
Use the Issues tab of this Actor. Add the run ID, your input and RUN_SUMMARY.status and message. Do not send API tokens.


