Instagram Profile Monitor
Pricing
Pay per event
Instagram Profile Monitor
Monitor Instagram profiles over time and track follower growth, engagement metrics, and profile changes with historical data and visualizations.
Pricing
Pay per event
Rating
0.0
(0)
Developer
Hpix
Maintained by CommunityActor stats
0
Bookmarked
415
Total users
11
Monthly active users
5 months ago
Last modified
Categories
Share
ℹ️ About
Track Instagram profiles over time and monitor growth trends with historical data analysis and beautiful visualizations. Perfect for tracking competitors, influencers, or your own profile's performance.
✨ Features
- Track multiple profiles simultaneously with bulk monitoring
- Historical data storage - keeps a complete history of profile changes across runs
- Automated visualizations - beautiful Seaborn plots with follower growth, engagement metrics, and profile statistics
- Growth metrics - comprehensive analytics including absolute growth, percentage change, and daily averages
- Change detection - automatically detects and reports changes in followers, following, posts, bio, and more
- Customizable time ranges - analyze data from the last 7, 30, 90 days or more
- Engagement analytics - track average likes, comments, and views over time
⚙️ Inputs
- profiles: A list of Instagram usernames to monitor (e.g.,
["zuck", "instagram"]) - history_days: Number of days of historical data to include in plots and analytics (default: 90 days)
Example:
This input will monitor three Instagram profiles and generate analytics for the past 30 days:
💰 Pricing
The actor uses a simple, usage-based pricing model that charges based on the actions performed during each run.
| Action | Standard Price | Business (Gold Discount) |
|---|---|---|
| Start Tracking | $0.01 per run | $0.005 per run |
| New Profile Discovery & Baseline | $0.04 per profile | $0.024 per profile |
| Historical Snapshot & Trend Analysis | $0.02 per profile | $0.012 per profile |
How it works:
- Start Tracking: A fixed fee charged once per run, regardless of the number of profiles
- New Profile Discovery: Only charged when monitoring a profile for the first time (creates baseline data)
- Historical Snapshot: Charged for each profile on subsequent runs (adds data points and generates visualizations)
Example: Monitoring 5 Profiles Weekly
Let's calculate the cost for monitoring 5 Instagram profiles with weekly runs over one month:
Initial Run (Week 1):
- Start Tracking: $0.01
- New Profile Discovery (5 profiles): 5 × $0.04 = $0.20
- Total: $0.21
Subsequent Runs (Weeks 2-4):
- Start Tracking: $0.01 per run
- Historical Snapshot (5 profiles): 5 × $0.02 = $0.10
- Per run: $0.11
- 3 runs: 3 × $0.11 = $0.33
Monthly Total (4 weeks): $0.21 + $0.33 = $0.54 (Standard) / $0.32 (Business)
Running this monitoring setup continuously would cost approximately $2.16/month (Standard) or $1.30/month (Business) with 4 weekly runs.
Tips
- Run the actor on a schedule (daily or weekly) to build historical data over time
- The actor persists data between runs, so each execution adds to your historical dataset
- For best results, monitor profiles consistently to detect trends and changes
📄 Outputs
The actor provides three distinct data views:
1. Profile Overview
Complete snapshot of each profile including:
- Profile picture
- Username and bio
- Current statistics (followers, following, posts, engagement metrics)
- Growth metrics with detailed analytics
- Detected changes from the previous run
This view shows the full profile data structure with all available information in one place.
2. Statistics & Growth
Clean tabular view showing current stats alongside growth percentages:
- Followers + Growth %
- Following + Growth %
- Total Posts + Growth %
- Avg Likes + Growth %
- Avg Comments + Growth %
- Avg Views + Growth %
Perfect for quickly comparing multiple profiles and spotting growth trends at a glance.
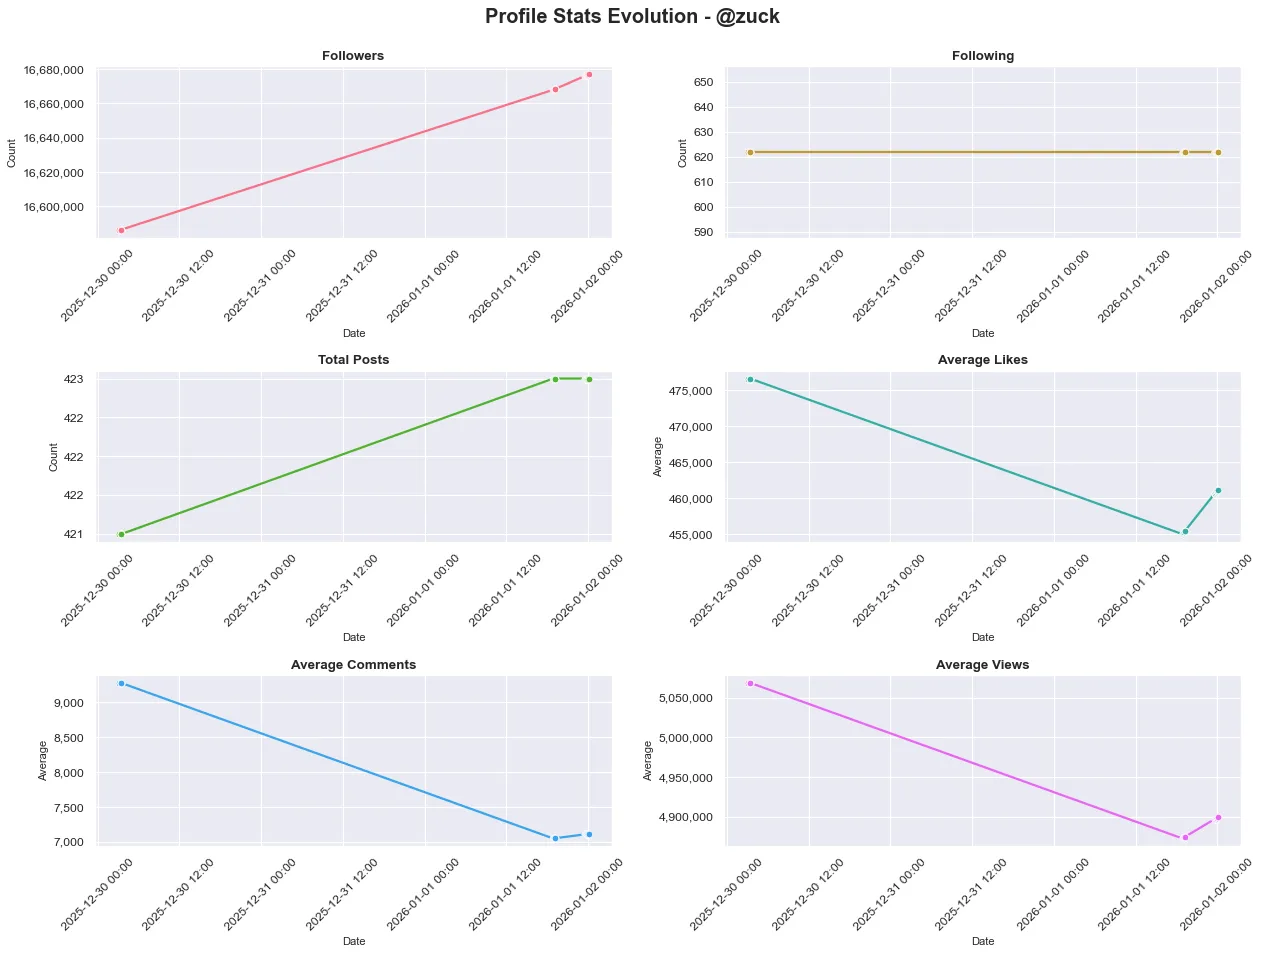
3. Dashboard (Visual Analytics)
Beautiful Seaborn-generated visualizations:
- All Stats Summary - 3x2 grid showing all metrics in one view
- Followers Evolution - Track follower growth over time
- Following Evolution - Monitor following changes
- Total Posts Evolution - Track posting frequency
- Followers Growth Rate - See growth velocity with percentage changes
- Post Growth Rate - Analyze content production trends
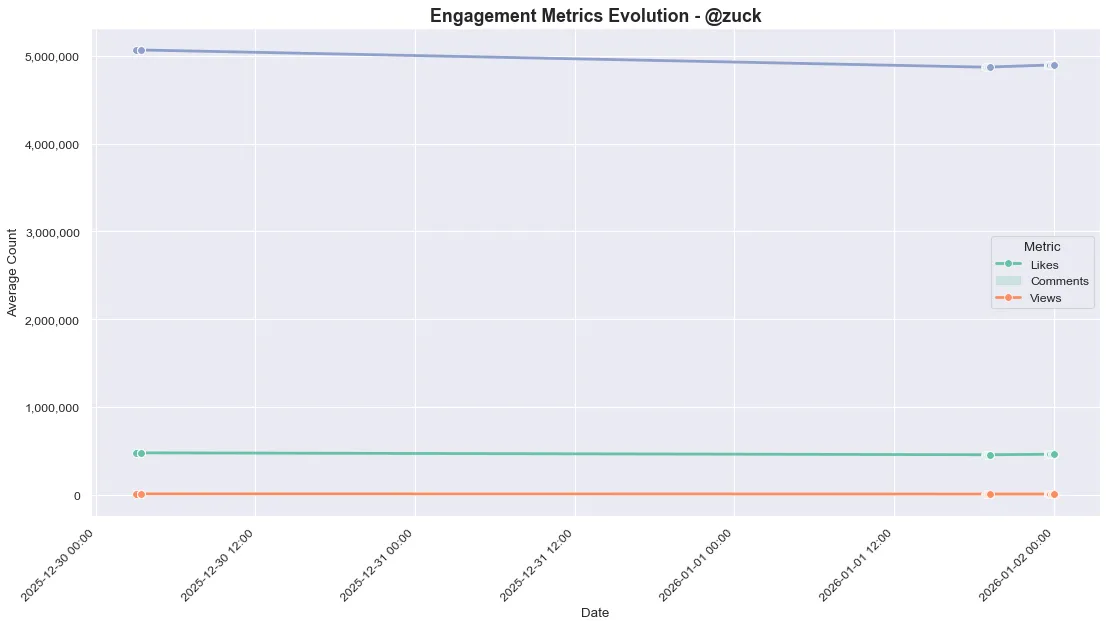
- Engagement Metrics - Combined likes, comments, and views analysis
- Aggregated Metrics - Advanced analytics dashboard with 5 key performance indicators:
- Engagement Rate - Standard influencer quality metric (Likes + Comments) / Followers × 100
- View-to-Engagement Ratio - Content effectiveness measuring "scroll-stopping power"
- Post Frequency - Content consistency analysis (posts per day)
- Comment-to-Like Ratio - Audience intent indicator (high values = high-intent content)
- Growth Rate - Follower trend tracking from baseline
All visualizations are automatically generated and stored as PNG images.
Complete Data Structure
The underlying data structure for each profile:
📃 Changelog
Do you have a feature suggestion? Create an issue and let me know!
v1.0.0
- ✨ Added Aggregated Metrics visualization with 5 key performance indicators
- ✨ Added growth analytics with absolute, percentage, and daily average calculations
v0.1.0 (Initial Release)
- ✨ Multi-profile monitoring with historical tracking
- ✨ Automated visualization generation
- ✨ Change detection for all profile metrics
- ✨ Engagement analytics (likes, comments, views)
- ✨ Customizable history lookback period
📖 FAQ
How does historical tracking work?
The actor stores profile data that persists between runs. Each time you run the actor, it adds a new snapshot to the history, allowing you to track changes over time.
What happens on the first run?
On the first run, the actor creates a baseline snapshot of each profile. Subsequent runs will compare against this baseline and show changes. Growth metrics and visualizations require at least 2 data points, so they'll appear starting from the second run.
Can I track private accounts?
No, the actor can only track public Instagram profiles since it relies on publicly accessible data.
How often should I run this actor?
For best results, run it on a **daily or weekly schedule **. This builds a comprehensive historical dataset and helps you identify trends and patterns.
Can I export the data to Excel?
Yes! Apify allows you to download results in multiple formats including Excel, CSV, JSON, XML, HTML, JSONL, and RSS.
I found a bug! Can you fix it?
Please create an Issue with details about the problem, and I'll investigate it.
Can you add a new feature?
Absolutely! Use the **Issues ** tab to suggest new features or enhancements.
⚠️ Disclaimer
This Actor monitors public data from Instagram profiles. Features are subject to changes made by Meta. Use responsibly and in accordance with Instagram's Terms of Service.
⛓️💥 Known issues
- Private and age-restricted accounts cannot be monitored (they're not publicly accessible)
- Very new profiles with minimal posting history may not have enough data for meaningful analytics
- Visualization generation requires at least 2 historical data points
👀 See also
- Instagram Reels Scraper: Scrape Instagram posts, profiles, and Reels with detailed metadata
- Agentic Crawler: An intelligent web crawler powered by AI
- Bubble Sync: Synchronize data from Apify to Bubble