Status Page
Pricing
Pay per usage
Go to Apify Store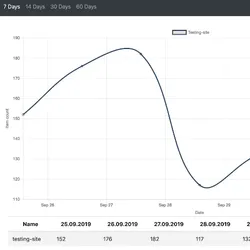

Status Page
Show charts with daily counts of your datasets. Useful for monitoring periodical scrapes.
Pricing
Pay per usage
Rating
0.0
(0)
Developer
Jan Novotný
Maintained by CommunityActor stats
2
Bookmarked
11
Total users
1
Monthly active users
4 years ago
Last modified
Categories
Share