Status Page
Pricing
Pay per usage
Status Page

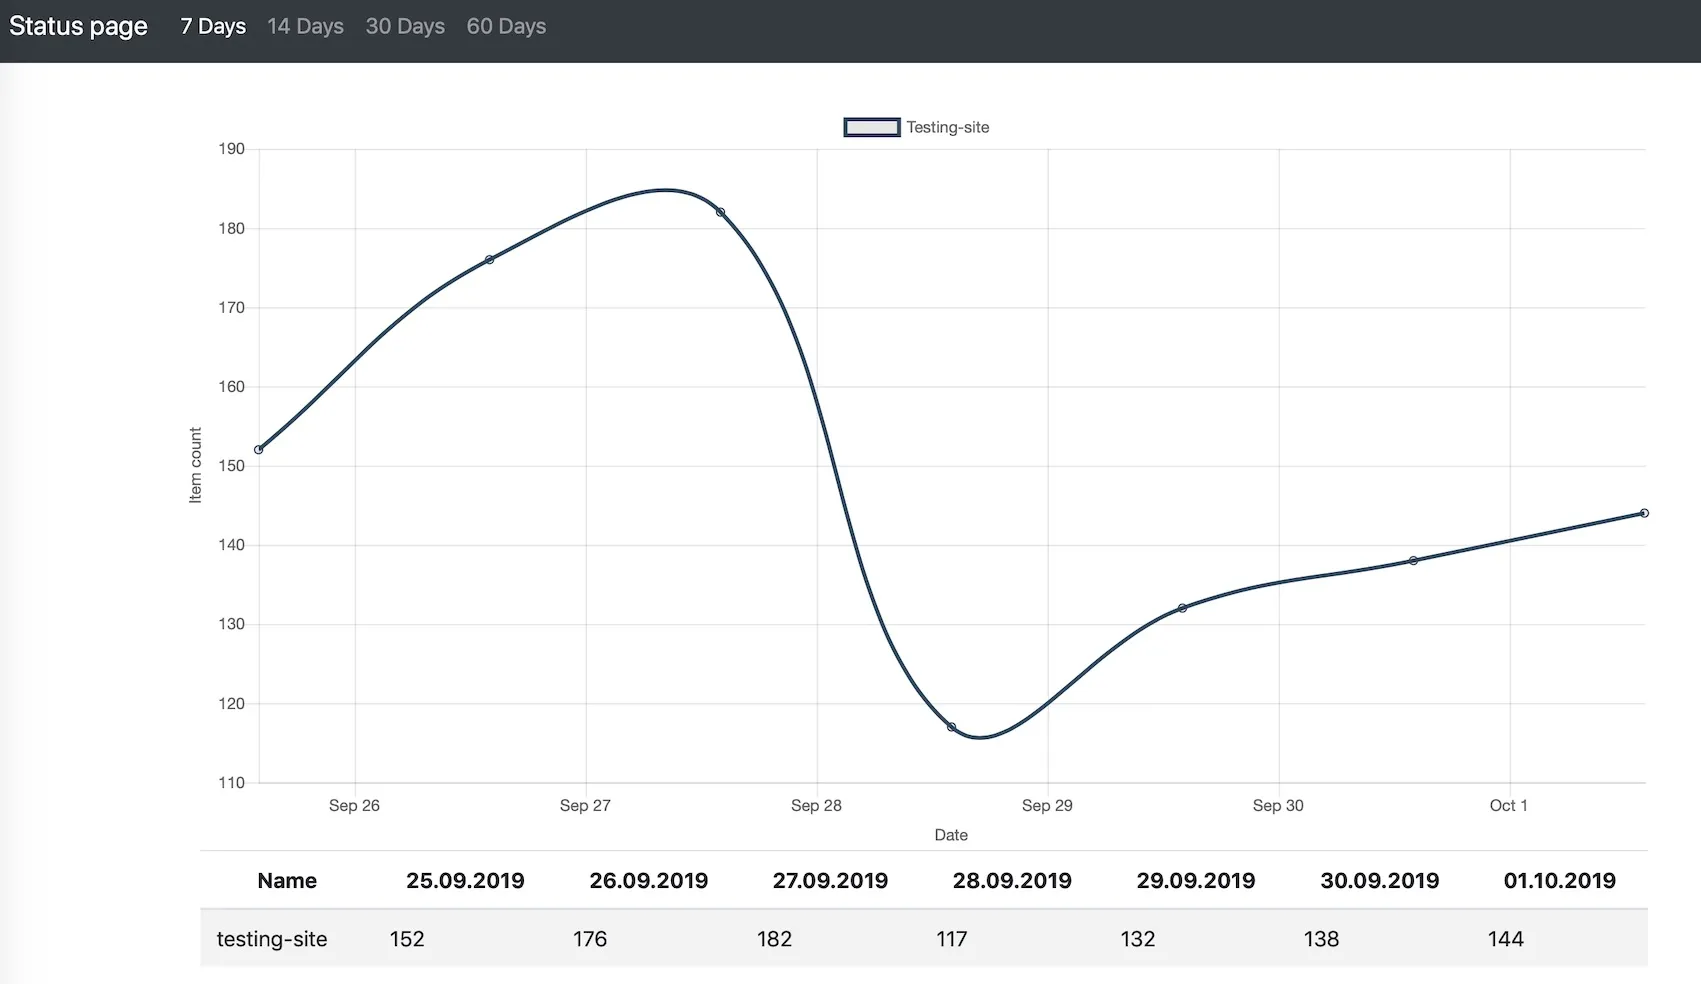
Show charts with daily counts of your datasets. Useful for monitoring periodical scrapes.
0.0 (0)
Pricing
Pay per usage
2
Total users
8
Monthly users
1
Runs succeeded
>99%
Last modified
3 years ago
Start a webserver with the status page
Use following input for starting a status page server:
intervals- array with time intervals that should be displayed, possible value are"day", "week", "two-weeks", "month", "two-months"charts- array of charts that should be displayed on the dashboardid- string - an unique id of this chart. Will be used to store data.name- string - name of chart that will be displayed on the dashboardshowTable-falseby default. Iftruethen there will be a table under the chart with the name of actor and daily dataset size
You will see following line in actor log:
Copy this url to your browser and get ready to be amazed 😎🍿
Persistent url
Every actor starts with public URL which is different for every run. You can use rebrand.ly app to have a persistent URL. Actor is prepared to update your rebrand.ly with every start. Just add this to the input:
Storing data
Webhooks can be used to store dataset statistics or call store task using Apify.call directly from your actor.
Use following input for storing a dataset info manually:
- name - string - a name of actor or site it crawles.
- datasetId - string - an id of dataset
- chartId - string - an id of a chart
- color - optional string - what color (in hex format) should be used to display data. If not set some color will be picked randomly.
Using webhooks to store data
Just create a webhook under your actor or task for Run succeeded event.
Set the url to start dashboard task. Actor will open default dataset of finished run and collect its statistics.
You can add a custom name to the payload template as "name": "hackernews.com".
If there is no name set, then dashboard will lookup actor name and use that as a name for data line.
Same with color or chartId attributes.