

SPICE Circuit Simulator: ngspice Netlists, Bode & Transient
Pricing
Pay per event
SPICE Circuit Simulator: ngspice Netlists, Bode & Transient
Simulate SPICE netlists with ngspice: DC operating point, sweeps, AC Bode plots, transients, transfer functions and .meas. Node voltages, currents, power, gain, bandwidth, phase margin, waveform stats, charts and CSV. Common parts built in. For AI agents.
Pricing
Pay per event
Rating
0.0
(0)
Developer

Jumble Mog
Maintained by CommunityActor stats
0
Bookmarked
2
Total users
1
Monthly active users
7 days ago
Last modified
Categories
Security
Limited permissionsShare
Simulate an electronic circuit from its SPICE netlist and get the numbers, the charts and the data back. Paste a netlist, the kind in textbooks, application notes, LTspice exports or written by an AI assistant, and it runs in ngspice, the open-source SPICE simulator: DC operating point, DC sweeps, AC (Bode) frequency response, transients and transfer functions, with your .meas measurements. Every circuit comes back with node voltages, currents and power in every source and resistor, gain, -3 dB bandwidth, unity-gain frequency and phase margin, waveform minimum, maximum, RMS and frequency, plus charts (PNG and SVG), CSV data of every point, Markdown and JSON. Common diodes, LEDs, Zeners, transistors, MOSFETs, a generic op-amp and a comparator are built in, so a netlist that uses 1N4148, 2N3904, 2N7000 or OPAMP_RAILS runs without its .model lines. Made for electronics students and teachers, hobbyists and makers, hardware engineers checking a design idea, writers of tutorials, developers of electronics tools, and AI agents that need a circuit's real behavior instead of a guess.
What it does
- Runs a SPICE netlist in ngspice and returns every analysis it asks for:
.op,.dc,.ac,.tranand.tf. With none, it finds the DC operating point. - Reads the results for you: node voltages, the current and power of every voltage source and resistor, total power drawn; for AC, the gain at the lowest frequency, the peak, the -3 dB corner (or band), the unity-gain frequency and phase margin; for transients, the minimum, maximum, average, RMS, peak-to-peak, final value and frequency of each signal; for
.tf, the gain and input and output resistance. - Your
.measmeasurements (rise times, delays,WHEN,FIND ... AT,MAX,AVG,RMS,INTEG) come back as named numbers, with a clear note when one never happened. - Charts and data: a Bode plot (gain and phase on a log frequency axis), waveform and sweep charts as PNG and SVG, a CSV of every point the simulator computed, an evenly sampled copy of the data in the result, a Markdown report and the exact netlist that ran.
- Built-in parts with typical values: diodes
1N4148,1N914,1N4001,1N4007, Schottky1N5819,1N5822, Zeners1N4733(5.1 V),1N4742(12 V),1N750,BZX55C3V3, LEDsLED_RED,LED_YELLOW,LED_GREEN,LED_BLUE,LED_WHITE, transistors2N3904,2N3906,2N2222,2N2907,BC547B,BC557B,TIP31C,TIP32C, MOSFETs2N7000,BS170,BS250,IRF540N,IRLZ44N,IRF9540N, and the subcircuitsOPAMP(in+ in- out, ideal-like with 1 MHz gain-bandwidth and no supply limits),OPAMP_RAILS(in+ in- vcc vee out: 100 dB gain, 1 MHz gain-bandwidth, 1 V/µs slew rate, output to within 20 mV of the supplies and clean recovery from clipping) andCOMPARATOR(in+ in- vcc vee out). Common spellings likeQ2N3904,D1N4148andBC547work too. - Clear errors: a missing model or subcircuit, a missing ground, a node with no DC path to ground or a transient that won't converge comes back with the reason and what to change, and is never charged.
- Many circuits in one run: up to 50, such as one per component value, each with its own analyses and settings.
Who it's for
- Students and teachers: check homework and lab circuits, see a filter's Bode plot or a transistor's bias point, and make charts for slides and handouts.
- Hobbyists and makers: try an LED driver, a 555-style oscillator, a MOSFET switch or an op-amp stage before soldering.
- Hardware engineers: a quick SPICE run from a script or a pipeline without installing a simulator, with values swept over many runs.
- Writers and educators: correct numbers and clean charts for tutorials and articles.
- Developers: a SPICE simulation API for electronics calculators, learning apps and design tools, billed per circuit with no monthly plan.
- AI agents and LLM apps: language models often get circuit math wrong. An agent can write the netlist, simulate it here and answer from the real operating point, gain or waveform, with a chart to show the user.
How to use it
- Paste the netlist into SPICE netlist. The form starts with a 1 kHz active low-pass filter, so you can click Start right away.
- Add analyses or measurements in their own boxes if the netlist doesn't have them, and list the Signals to report (such as
v(out)ori(V1)) to chart only those. - Click Start. The Overview shows each circuit's summary and chart, Analyses each analysis with its numbers and file links, and Measurements every
.measresult.
You can also run it through the Apify API, from Make, n8n, Zapier and other integrations, or as a tool for AI agents.
Writing a netlist
Standard SPICE, as ngspice reads it. A short reminder:
- The first line is the title. If it's already a component, a title line is added for you.
- Node
0(orgnd) is ground, and every circuit needs it. - Values take SPICE suffixes:
f p n u m k meg g t. Note thatmis milli andmegis mega, so a 1 megohm resistor is1meg; the result warns about resistors written like1M. - Sources:
DC,AC(the AC analysis's input),SIN(offset amplitude frequency),PULSE(v1 v2 delay rise fall width period),PWL(t1 v1 t2 v2 ...). - Devices: R, C, L, coupled inductors (K), diodes (D), BJTs (Q), MOSFETs (M), JFETs (J), switches (S, W), controlled sources (E, F, G, H), behavioral sources (B) and subcircuits (X), with your own
.model,.subckt,.paramand.funclines. - Analyses:
.op;.dc V1 0 5 0.1;.ac dec 50 10 100k;.tran 10u 5m(step, stop, and optionally start and maximum step);.tf v(out) V1. Up to 12 per circuit. - Measurements (
.meas tran|ac|dc name ...) follow ngspice's syntax. - Ignored:
.controlblocks (the Actor writes its own),.print,.plot,.fourand.probe(the results already hold everything), and.end..step,.noise,.pzand other analyses aren't supported yet: run one circuit per value with Several circuits instead.
Examples
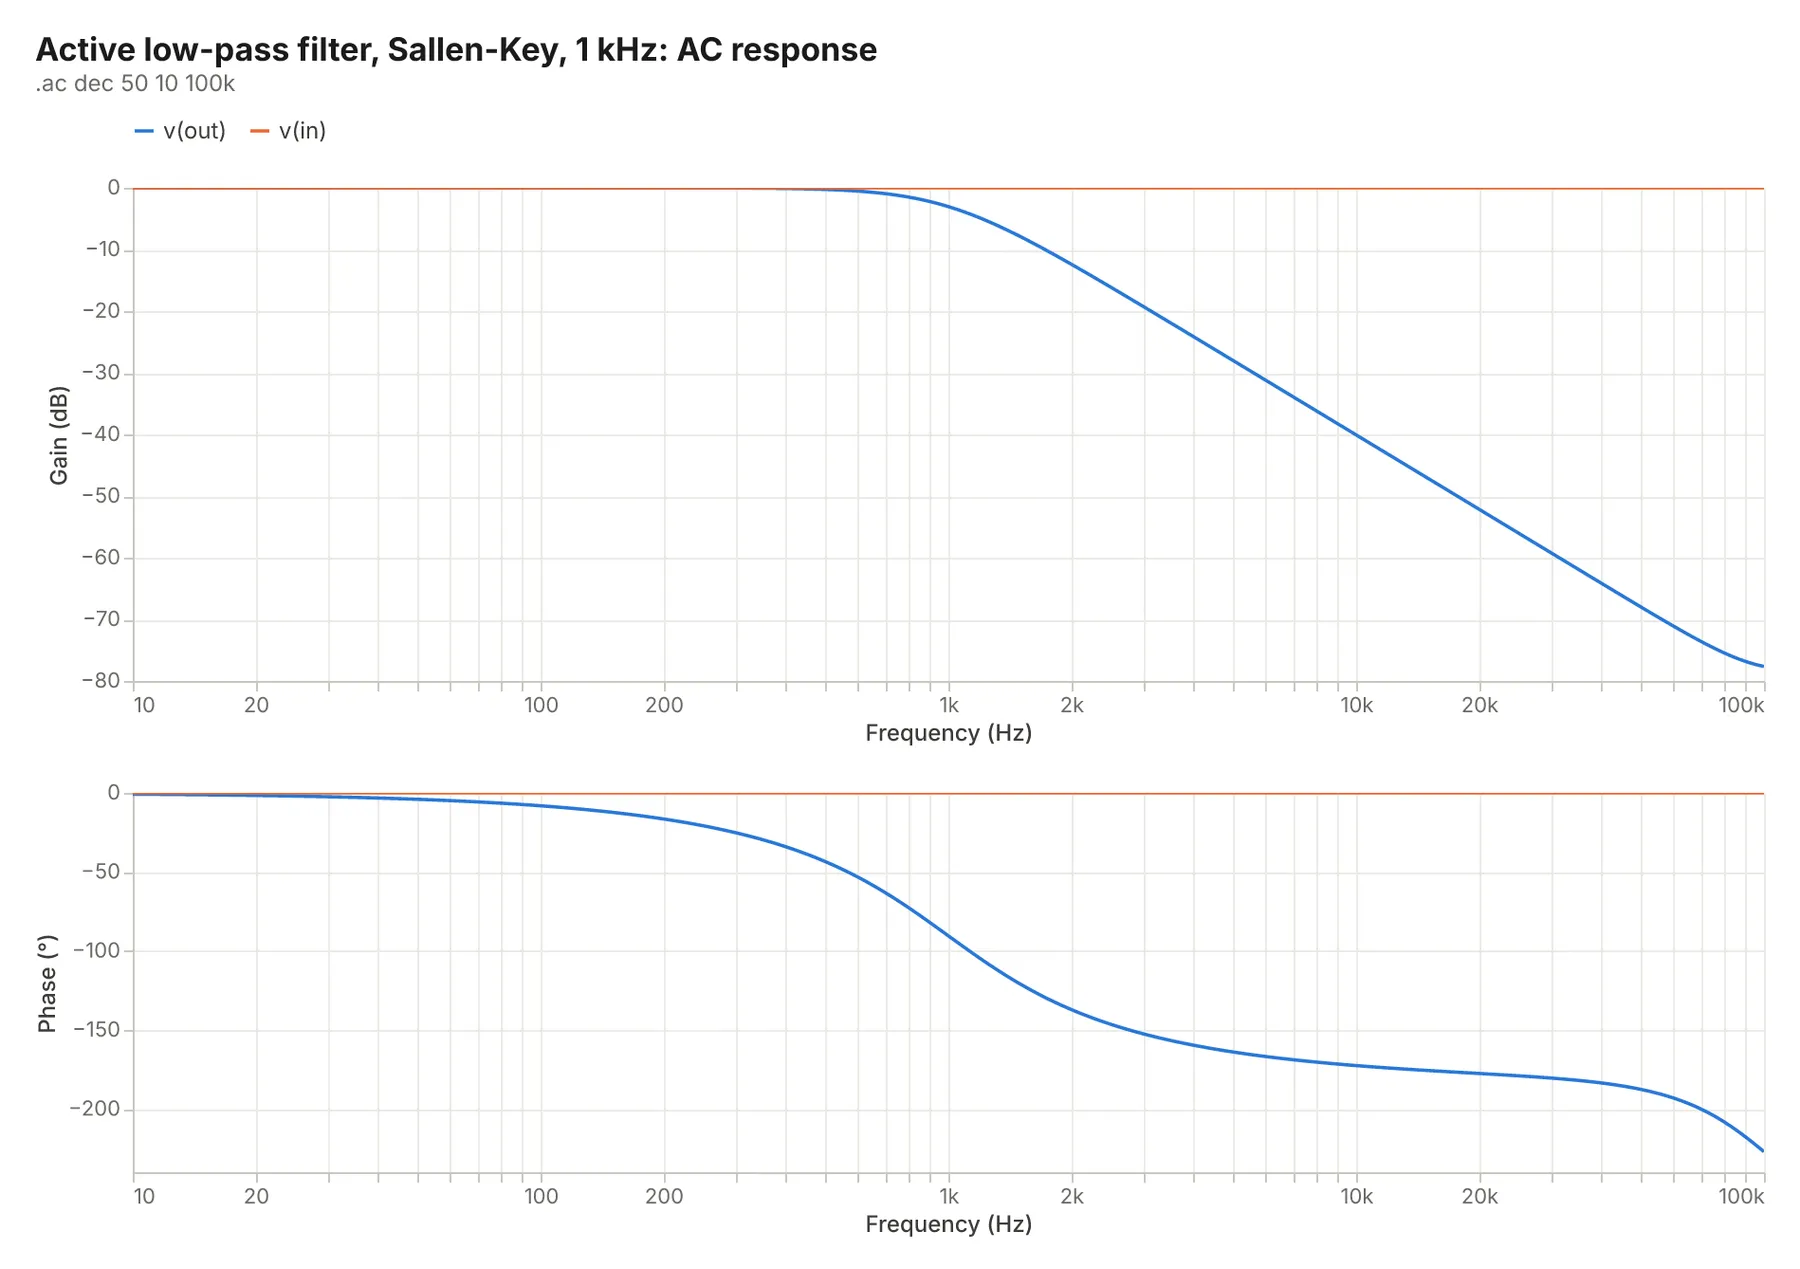
An active filter's corner frequency. The form's example, a Sallen-Key low-pass filter with 11.3 kΩ, 20 nF and 10 nF around a generic op-amp, with signals v(out) and v(in):
AC analysis: v(out): 0 dB at 10 Hz, -3 dB at 995.7 Hz; v(in): 0 dB at 10 Hz. Transient: v(out): -969.4 mV to 969.4 mV, average 9.459 mV, RMS 681.7 mV, final -668.4 mV, 500 Hz; v(in): -0.9997 V to 0.9997 V, average 57.98 nV, RMS 707.1 mV, final -1.225 fV, 500 Hz. Measurements: gain_1k = -3.0462.
A transistor amplifier's bias point and gain. A common-emitter stage with a 2N3904 from the built-in library:
Operating point: v(in) = 0 V, v(b) = 2.028 V, v(c) = 5.673 V, v(e) = 1.356 V, v(vcc) = 12 V; the sources deliver 18.7 mW. AC analysis: v(c): -11.49 dB at 10 Hz, peak 6.9 dB at 31.62 kHz, -3 dB (high-pass) at 82.14 Hz. Measurements: gain_mid = 6.8975.
The result also lists each resistor's voltage, current and power (RC: 6.327 V, 1.346 mA, 8.518 mW). With a 10 mV input, 6.9 dB at the collector is a voltage gain of about 220.
An RC step response. V1 in 0 PULSE(0 5 0 1n 1n 5m 10m), R1 in out 1k, C1 out 0 1u, .tran 10u 5m and the rise-time measurement above:
Transient: v(out): 0 V to 4.966 V, average 4.007 V, RMS 4.191 V, final 4.966 V; v(in): 0 V to 5 V, average 5 V, RMS 5 V, final 5 V. Measurements: rise = 0.0021972.
The 10% to 90% rise time is 2.197 ms, which is 2.197 RC, as it should be.
How-to examples
These are examples from Examples above; the result lines are from their runs.
How to simulate a SPICE netlist online
Result: "Operating point: v(in) = 0 V, v(b) = 2.028 V, v(c) = 5.673 V, v(e) = 1.356 V, v(vcc) = 12 V; the sources deliver 18.7 mW. AC analysis: v(c): -11.49 dB at 10 Hz, peak 6.9 dB at 31.62 kHz, -3 dB (high-pass) at 82.14 Hz. Measurements: gain_mid = 6.8975." The 2N3904 comes from the built-in parts library, and each resistor's voltage, current and power is listed.
How to find a filter's -3 dB frequency (a Bode plot)
Add an .ac analysis to the filter's netlist, as in the form's Sallen-Key example. Result: "AC analysis: v(out): 0 dB at 10 Hz, -3 dB at 995.7 Hz", with a Bode plot of gain and phase.
How to get an RC circuit's step response and rise time
A netlist with V1 in 0 PULSE(0 5 0 1n 1n 5m 10m), R1 in out 1k, C1 out 0 1u, .tran 10u 5m and a .meas for the 10% to 90% rise gives "Measurements: rise = 0.0021972": 2.197 ms, which is 2.197 RC, as it should be. The transient chart and the data points come with it.
How to let an AI agent check a circuit
Add this Actor to the Apify MCP server with https://mcp.apify.com/?tools=jumblemog/circuit-simulator. The agent writes the netlist, runs it, and reads the operating point, the measurements and any convergence errors, instead of working out a circuit's behavior by hand.
FAQ
Which simulator does it use? ngspice, the open-source SPICE simulator.
Which analyses are there? DC operating point, DC sweeps, AC frequency response, transients and transfer functions, plus your own .meas measurements.
Does it read LTspice netlists? Yes, LTspice exports and textbook netlists work. Parts the netlist names but doesn't define, such as a 2N3904 or a generic op-amp, come from the built-in library, with typical values. Paste the vendor's .model or .subckt for exact behavior.
What do I get back? A summary in words, every measurement, charts of the signals you pick, and the data as CSV.
Does it work with Zapier, Make or n8n? Yes. Call the Actor with its Apify app or an HTTP request and pass the summary or the chart on.
Input
| Field | What it is |
|---|---|
netlist | The SPICE netlist (required unless circuits is given). |
analyses | Analysis lines to add, such as .tran 10u 5m. |
measurements | .meas lines to add. |
signals | Signals to chart and summarize: v(out), out, v(a,b) (a difference) or i(V1). Empty: up to 6 nodes that change, outputs first. |
title | A title for the results. Empty: the netlist's title line. |
temperature | The circuit's temperature in °C (default 27). |
dataPoints | Points per signal in the result's data (default 500). The CSV has every point. |
timeLimitSeconds | How long one circuit may simulate (default 60, up to 300). |
circuits | Several circuits: a list of objects with their own netlist and any field above, or of netlists as text. |
Output
One dataset item per circuit, also saved together in the run's OUTPUT record:
A transient's results hold min, max, average, rms, peakToPeak, final and frequency per signal; an operating point holds nodeVoltages, sources (voltage, current, power delivered) and resistors (voltage, current, power). A circuit that can't be simulated has "status": "failed" and the reason in error.
How it works
The netlist is checked and cleaned first: code fences, µ and Ω are removed, a title is added when needed, file access, .control blocks and shell commands are dropped or refused, ground is required, and parts used without a model are added from the built-in library. Each analysis then runs in ngspice in batch mode, with its measurements, and is written to its own binary raw file, which the Actor reads with NumPy. ngspice runs as an unprivileged user in an empty folder, with limits on CPU time, memory, file size and processes. Charts are drawn with Vega-Lite.
Pricing
You pay per circuit simulated, at the price shown on this page, with every analysis, chart and file included. Circuits that can't be simulated are never charged. Simulating past the first 30 seconds of a circuit adds a small simulation time charge per started 10 seconds; most circuits finish in well under a second, so it rarely applies. If you set a maximum cost per run, the Actor checks before each circuit that it fits and shortens the time limit to stay within it.
Speed
Most circuits simulate in a few hundredths of a second, and a run through the API answers in about 10 to 20 seconds, including the cloud container starting and the files being saved. Long transients of switching circuits (millions of time steps) take longer; set a maximum step or a shorter stop time to keep them quick.
Tips and limits
- Built-in parts are typical, not a manufacturer's exact model. Paste the vendor's
.modelor.subcktfor exact behavior; a part you define yourself always wins. .includeand.libonly work with built-in part names; files can't be read. Paste the model text into the netlist instead.- Floating nodes: a node joined only through capacitors, or an op-amp input with no DC path, makes the matrix singular. The result names such nodes; add a large resistor (such as
1G) to ground. - Transient convergence: give sources finite rise and fall times and set a maximum step (the 4th
.tranvalue) for switching circuits. - Not supported yet:
.step,.noise,.pz,.sens,.disto, S-parameters, XSPICE digital and file sources, and Verilog-A models. - Limits: 20,000 netlist lines, 12 analyses per circuit, 50 circuits per run, and up to 300 seconds of simulation per circuit.
For AI agents and developers
This Actor works with the Apify MCP server, so AI agents can call it as a tool: send the netlist and read summary, analyses[].results, measurements and imageUrl from the result. A direct API call that waits for the answer:
run-sync instead returns the run's OUTPUT: the status, how many circuits were simulated and every result as JSON.
In Python, with the apify-client package, sweeping a resistor over three values:
Credits
- Simulation: ngspice (BSD-3-Clause; some parts under other free licenses).
- Results: NumPy (BSD-3-Clause).
- Charts: vl-convert (BSD-3-Clause) with the Inter font (SIL Open Font License), subset with fontTools (MIT).


