

Restaurant Inspection Data Scraper - 7 US Cities
Pricing
from $2.40 / 1,000 results
Restaurant Inspection Data Scraper - 7 US Cities
Restaurant inspection data scraper for 7 US cities in one normalized schema: health grades, scores, violation detail, geocodes. Export CSV/JSON or monitor for new results.
Pricing
from $2.40 / 1,000 results
Rating
0.0
(0)
Developer
Brandt May
Maintained by CommunityActor stats
0
Bookmarked
2
Total users
1
Monthly active users
4 days ago
Last modified
Categories
Share
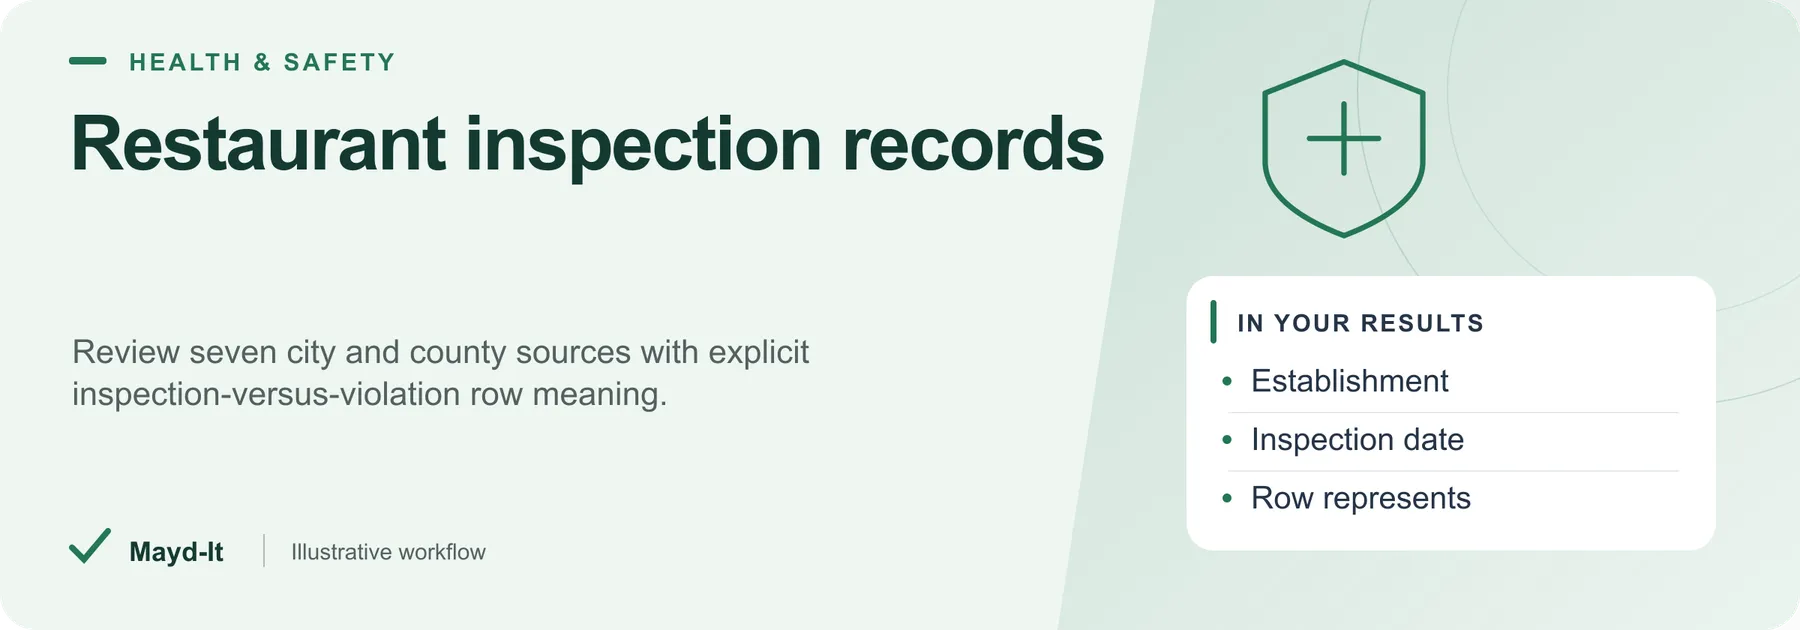
Restaurant inspection records
For food-safety research and local reporting, collect supported city and county inspection records in a shared field layout.
Coverage: Seven named portals only: NYC, Chicago, Cincinnati, Austin, King County, Boulder County and Montgomery County.
Open this Actor in Console · First run · Results · Cost · Full guide
Try this Actor
- Choose one supported portal, use the documented date or business-name filters, and lower the per-city result cap before combining sources.
- Open the dataset and inspect
sourceCityandgranularitytogether. ReadSUMMARYfor sources not reached or limits encountered.
Read the results correctly: One row may represent an inspection or a violation. Shared field names do not make different jurisdictions' grades, scores or risk systems equivalent.
Result preview
The dataset view highlights these columns:
- Source jurisdiction ·
sourceCity - Establishment ·
businessName - Address ·
address - Inspection date ·
inspectionDate - Inspection category ·
inspectionType - Published outcome ·
result
Use the original source links and the field definitions below when interpreting the results. CSV works well for flat columns; JSON preserves nested values.
Usage and pricing
Base result rate on the FREE tier: $4 per 1,000 results. The Pricing tab shows your plan's result rate and any Actor Start charge. Set a small result limit for the first run; the requested limit is not a guarantee of that many results.
Full guide
One restaurant inspection data scraper that unifies 7 US city and county health portals into a single normalized schema - grades, scores, violation detail, and geocodes included.
What it does
This restaurant health inspection API pulls food inspection data from 7 US city and county open-data portals - NYC, Chicago, Cincinnati, Austin, King County (Seattle), Boulder County (CO), and Montgomery County (MD) - and normalizes them into one consistent schema. Every competing actor is single-city (usually NYC-only), which forces you to run and reconcile multiple scrapers with mismatched fields. This food inspection data scraper does the reconciliation for you: one run returns restaurant health grades, numeric scores, risk levels, and violation detail wherever each city publishes them, ready to export as CSV or JSON.
Each city comes back at the level of detail its portal publishes - one row per violation or one row per inspection - and every row says which in its granularity field (see the table below). Filter by city, date range, business name, or result.
Who it's for
- Food-safety monitoring teams tracking new violations and failed inspections across multiple markets
- Journalists and investigators building restaurant inspection datasets for reporting
- Restaurant-tech and real estate platforms scoring locations by health history
- Insurers and risk analysts underwriting food-service businesses
- Consumer apps (food delivery, review, discovery) surfacing health grades and scores
What you get / Output
Each record is normalized to the same fields regardless of source city:
| Field | Description |
|---|---|
sourceCity | Which of the 7 portals the record came from |
businessName | Name of the establishment |
businessId | Source-portal identifier for the establishment (for Montgomery County it is the county's inspection number) |
facilityType | Type of facility (e.g. restaurant, mobile vendor) |
address | Street address |
zip | ZIP code |
inspectionDate | Date of the inspection |
inspectionType | Type of inspection (routine, complaint, re-inspection, etc.) |
result | Inspection outcome (e.g. pass, fail) |
score | Numeric inspection score where the city reports one |
grade | Letter/health grade where the city reports one |
riskLevel | Risk category where the city reports one |
violationCode | Code for the specific violation |
violationDescription | Text description of the violation. On per-inspection rows: the city's list of violations (Chicago) or the items found out of compliance (Montgomery County) |
critical | true when the source flags the violation as critical - NYC's "Critical" flag, King County's RED violations, or (on Montgomery County's per-inspection rows) any item marked (C) found out of compliance. Empty where the city publishes no such flag |
latitude | Geocoded latitude |
longitude | Geocoded longitude |
granularity | Whether the row is a violation or inspection record |
Not every city publishes every field (for example, letter grades and numeric scores vary by jurisdiction). Fields are populated where the source portal provides them and left empty otherwise - the schema stays constant so your downstream code never breaks.
One row per violation, or per inspection?
| City | granularity | What one row is |
|---|---|---|
| New York | violation | One cited violation, with code, description and critical flag |
| Cincinnati | violation | One cited violation, with code and the inspector's notes |
| King County (Seattle) | violation | One cited violation, with code, description and critical (RED) flag |
| Boulder County | violation | One inspector comment on a cited violation |
| Chicago | inspection | One inspection; its violations are listed together in violationDescription |
| Montgomery County | inspection | One inspection; the items found out of compliance are listed in violationDescription |
| Austin | inspection | One inspection score; Austin publishes no violation detail |
On violation rows, an inspection with several violations spans several rows that share businessId, inspectionDate, inspectionType, result and score; an inspection where nothing was cited, where the city publishes one, is a single row with empty violationCode and violationDescription. To count inspections rather than violations, group on those shared fields.
Input / How to query
Configure the run with these filters and modes:
- cities - pick any subset of the 7 supported portals, or all of them
- inspection date range - limit results to a start/end window
- business name - target a specific establishment or chain
- result contains - filter by outcome text (e.g.
fail; each portal words it differently - King County saysUnsatisfactory, CincinnatiNot In Compliance) - max run seconds - wall-clock budget for the run (default 240). Cities are fetched one after another; when the budget is reached the Actor stops cleanly, finishes successfully with the records it already has, names the cities it did not reach, and records
stoppedEarlyOnTimeLimit: truein the run'sSUMMARY. Raise it, together with the run timeout, for a deliberately large pull
Granularity is not a setting: each city is returned at the level its portal publishes (see the table above).
Example use cases
- Multi-city violation monitoring - pull NYC and King County (Seattle), which both publish one row per violation with a critical flag, on a nightly schedule and alert when new
criticalviolations appear. - Health-grade enrichment for a delivery app - fetch
grade,score, andresultperbusinessNameandaddressto display trust signals next to listings. - Investigative reporting - export failed inspections for a date range (
result contains: failfor Chicago and Montgomery County,unsatisfactoryfor King County), then map them withlatitude/longitudewhere the city geocodes them. - Real-estate site scoring - join
zip,facilityType, andriskLevelto evaluate the food-service risk profile of a commercial location. - Insurance underwriting - build a per-establishment inspection history keyed on
businessIdto price food-service policies.
Recurring use / scheduling
Set up a schedule in Apify (for example, daily or weekly) to keep an inspection dataset current for monitoring. Because each record carries businessId, inspectionDate, violationCode and violationDescription, you can dedupe incremental runs on that combination and flag only genuinely new inspections or violations - ideal for a restaurant inspection monitoring API that surfaces fresh failures and health-grade changes.
FAQ
How do I get restaurant health inspection data for multiple US cities?
Run this actor with the cities you need selected. It returns normalized inspection records - grades, scores, and violations - for any subset of NYC, Chicago, Cincinnati, Austin, King County (Seattle), Boulder County (CO), and Montgomery County (MD) in a single dataset.
Is there an API for restaurant inspection scores and grades?
Yes. This actor exposes inspection score, grade, result, and riskLevel fields through the Apify API and dataset exports, so you can pull them programmatically wherever the source city publishes them.
How do I download NYC and Chicago restaurant inspection data as CSV?
Select NYC and Chicago as your cities, run the actor, and export the resulting dataset as CSV (JSON, Excel, and other formats are also available). Both cities come back in the same normalized schema, so there's nothing to reconcile.
How can I monitor restaurant health inspection results for new violations?
Schedule the actor to run on an interval for the cities you track, then dedupe on businessId + inspectionDate + violationCode + violationDescription to detect records you haven't seen before - especially those flagged critical (NYC, King County and Montgomery County publish that flag).
Where can I get restaurant food safety violation data in bulk?
Run with a broad date range. NYC, Cincinnati, King County (Seattle) and Boulder County come back one row per violation, with violationCode (NYC, Cincinnati, King County), violationDescription, and the critical flag (NYC, King County); Chicago and Montgomery County list each inspection's violations in violationDescription - all in one export.
How do I normalize restaurant inspection grades across different cities?
That's the core job of this actor. Each of the 7 portals uses different field names and formats; the actor maps them all to one schema (grade, score, result, riskLevel, and more) so grades are comparable across cities.
What is the best restaurant inspection data API for a food delivery or review app?
For multi-city coverage in a single schema, this actor is purpose-built for it: pull grade, score, result, address, and geocodes per establishment and drop them straight into your app's listings without stitching together separate single-city scrapers.
How do journalists get restaurant inspection records for investigations?
Filter by date range, result contains (fail, or the word the city uses), and the cities in scope, then export the full dataset with violation detail and latitude/longitude for mapping and analysis - all from public health-department records.
Data source & notes
Data comes from the official public open-data portals operated by each city or county (NYC, Chicago, Cincinnati, Austin, King County/Seattle, Boulder County CO, and Montgomery County MD), served via their Socrata open-data APIs. These are public government records published by the respective health departments.
Notes and limitations:
- Field coverage varies by city - jurisdictions that don't issue letter grades or numeric scores will leave
grade/scoreempty, while the rest of the schema stays consistent. - Data freshness reflects whatever each portal has published; the actor does not add records beyond what the source provides.
- Montgomery County's portal re-publishes its whole inspection list (roughly the last two years) every day. The actor reads only the newest daily copy, so each inspection appears once, in its latest version, and Montgomery County results reach back roughly two years.
- Boulder County's portal republishes some inspections, so the same row can appear there twice, identical in every column; the actor returns such a copy once (the run summary counts how many were skipped). Other cities' rows are returned as published. Two rows can still look alike when they differ only in a column this schema does not carry or in formatting it normalizes (for example a 9-digit vs 5-digit ZIP).
- Coverage is limited to the 7 supported portals listed above.
Related actors
Part of a set of US public-records tools that work well together:
- New Business Leads Scraper - catch restaurants when they first register
- US Building Permits Scraper - build-out and remodel permits for the same venues
See the full collection at apify.com/maydit.
Free guide: Where US cities publish restaurant inspection data - the undocumented traps in this data source, measured against the live API.
Found this useful?
If this actor saved you time, a short review on the Apify Store genuinely helps. Reviews are how the next person decides whether a tool is worth trying.
Something broken, missing a field, or a source you want covered? Open an issue on the Issues tab and it will get looked at - that is the fastest route to getting it changed.
Run spending limits
The run stops at its spending limit. SUMMARY.datasetItemsSaved reports the number of rows actually saved, and SUMMARY.stoppedOnChargeLimit identifies this stop. A final batch may be saved only in part; increase the spending limit to collect more results.
Help with your run
Open the Issues tab on this Actor with the run URL, the input field that caused trouble and what you expected to receive. Remove API keys and private information before posting.
Understand your run
Open Run report in the run’s Output tab for saved-record counts, reported source issues and limits, and suggested next steps. Use CSV export to take the saved results into a spreadsheet. The existing JSON results and detailed machine-readable summary remain available.
The report reflects this run’s recorded coverage. A successful run or a saved result does not establish that every possible source record was collected.


