

Australia ASX Stock Quotes: Price, Franking & Fundamentals
Pricing
from $0.70 / 1,000 results
Australia ASX Stock Quotes: Price, Franking & Fundamentals
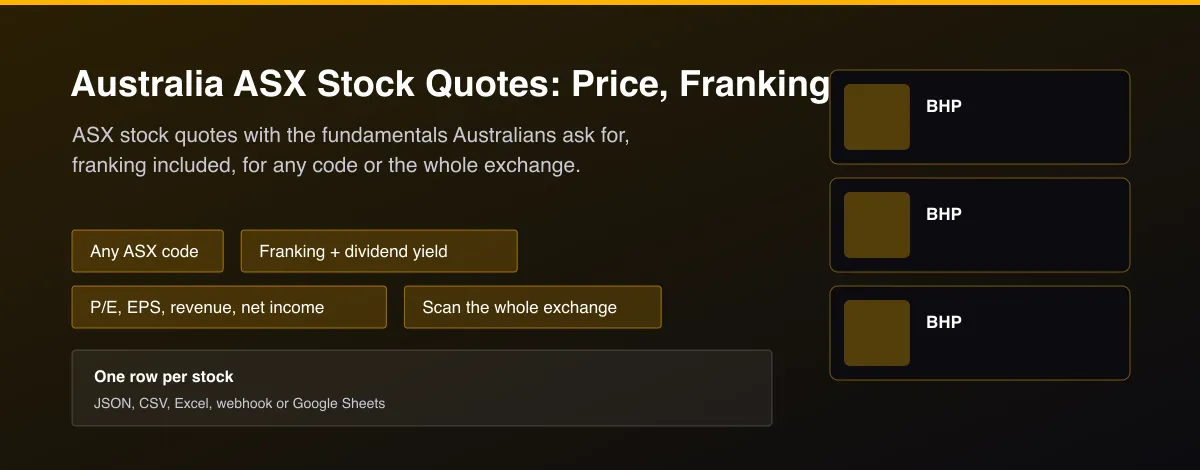
ASX stock quotes from public exchange data: price, change, 52-week range, market cap, P/E, EPS, dividend yield, franking, latest revenue and net income, sector. Any ASX code, or scan every listed company.

What does Australia ASX Stock Quotes: Price, Franking & Fundamentals do?
Australia ASX Stock Quotes returns one row per ASX-listed security from public exchange data. Each row has the last price in Australian dollars, change and percent change, previous close, bid and ask, day range, volume and average volume, the 52-week range and where the price sits in it, market capitalisation and shares outstanding, price to earnings ratio, earnings per share, dividend yield, dividend per share, franking percentage and the ex-dividend and payment dates, free cash flow yield, the latest fiscal year's revenue and net income, sector, industry group, ISIN and listing date. Give it a list of ASX codes, or switch on the whole-exchange scan to read every listed company from the exchange's own list.
Why use Australia ASX Stock Quotes: Price, Franking & Fundamentals?
- The fields Australian investors screen on: dividend yield, franking, P/E, EPS and free cash flow yield.
- Latest fiscal-year revenue and net income in every row.
- Scan mode reads every ASX-listed company from the exchange's own list.
- Unknown codes are skipped without stopping the run.
- No API key or login, bulk codes per run, billed only for rows returned.
What makes this different
Franking, yield and fundamentals for ASX stocks normally means clicking through broker pages one at a time. This Actor returns them for a whole watchlist, or the whole exchange, as tidy rows ready for a screen or model.
Who can use the Australia ASX Stock Quotes and how?
- Income investors: screen by dividend yield and franking.
- Quant researchers: collect fundamentals and range features for all ASX stocks.
- Newsletter writers: publish a daily ASX table.
- Fintech apps: show ASX quotes and fundamentals.
- Advisers: track client holdings and dividend dates.
- AI agent builders: let an assistant answer what an ASX stock trades at.
- Analysts: scan the whole market for value or momentum.
- Students: free ASX data for coursework.
How it works
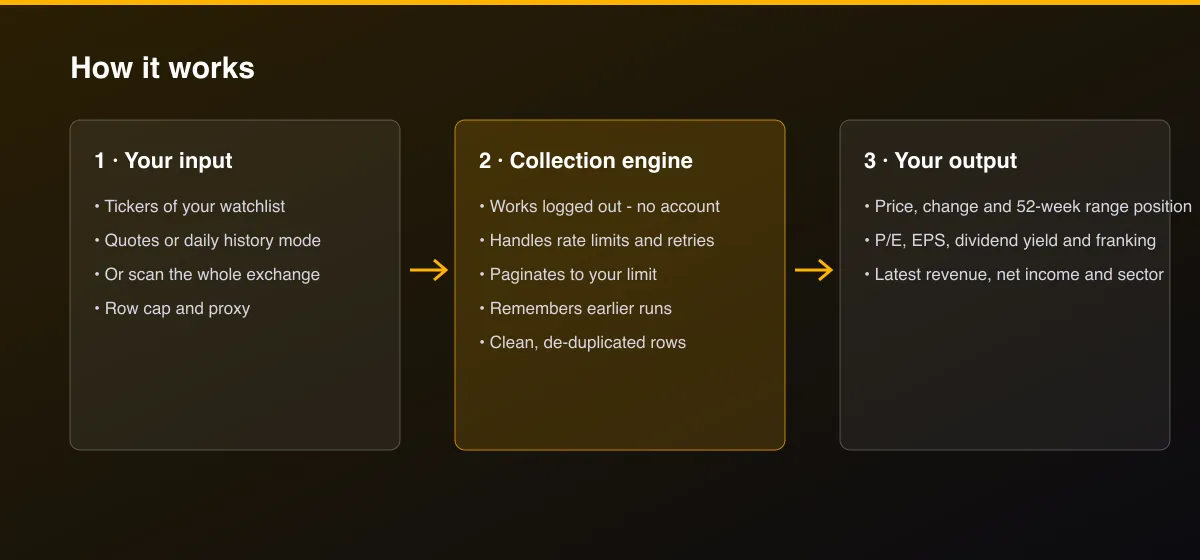
- Your input — list the tickers (or ISINs).
- The Actor collects it — the Actor reads ASX public market data for each one.
- Your output — you get one row per stock with price, change, range position and fundamentals.
What data can you extract?
The dataset has 41 fields per row:
| Field | Type | Description |
|---|---|---|
record_type | string | quote or bar. |
ticker | string | Ticker symbol. |
name | string | Company or fund name. |
isin | string | ISIN. |
currency | string | Trading currency. |
price | number | Last price. |
change | number | Change from the previous close. |
change_pct | number | Change from the previous close, percent. |
previous_close | number | Previous close. |
bid | number | Best bid. |
ask | number | Best ask. |
day_low | number | Day low. |
day_high | number | Day high. |
volume | number | Volume in shares. |
average_volume | number | Average daily volume. |
week52_low | number | 52-week low. |
week52_high | number | 52-week high. |
range_position_52w_pct | number | Where the price sits in its 52-week range, 0 = at the low, 100 = at the high. |
market_cap | number | Market capitalisation. |
shares_outstanding | number | Shares outstanding. |
pe_ratio | number | Price to earnings ratio. |
eps | number | Earnings per share. |
dividend_yield_pct | number | Dividend yield, percent. |
dividend_per_share | number | Latest dividend per share. |
dividend_currency | string | Currency of the dividend. |
franking_pct | number | Franking credit percentage. |
ex_dividend_date | string | Ex-dividend date. |
dividend_pay_date | string | Dividend payment date. |
free_cash_flow_yield_pct | number | Free cash flow yield, percent. |
latest_revenue | number | Revenue of the latest fiscal year. |
latest_net_income | number | Net income of the latest fiscal year. |
latest_fiscal_period | string | Latest fiscal period. |
reporting_currency | string | Currency of the financials. |
sector | string | Sector. |
industry_group | string | GICS industry group. |
date_listed | string | Date first listed. |
as_of | string | When the data was read. |
fetch_path | string | How the data was obtained. |
source | string | Data source. |
scraped_at | string | Timestamp. |
actor_version | string | Actor version. |
How to use Australia ASX Stock Quotes: Price, Franking & Fundamentals
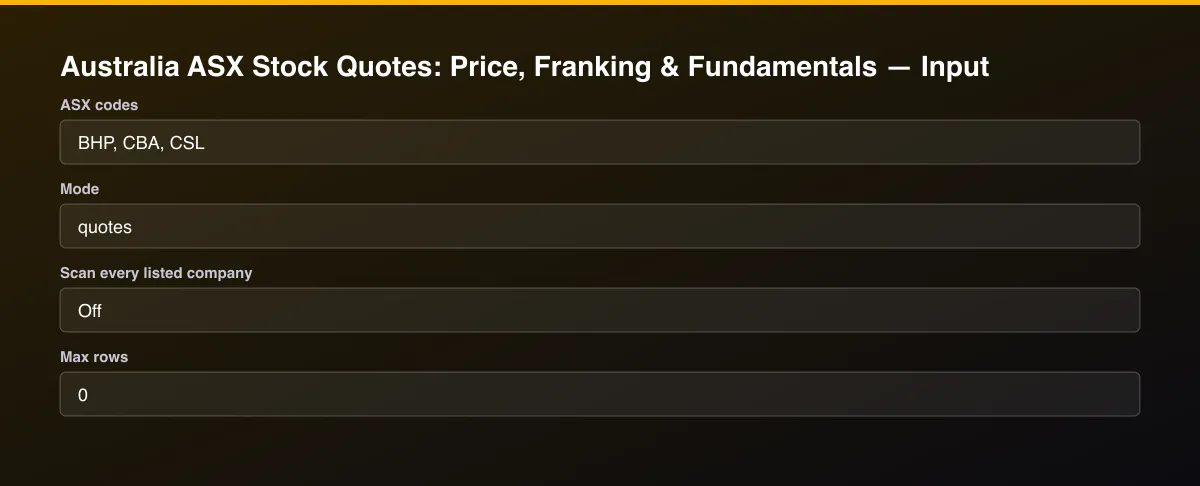
- Open the Actor and go to the Input tab.
- Enter Tickers (for example
BHP,CBA,CSL,WES) and run. To read the whole exchange, turn on Scan every listed company and set Max rows; a full scan takes a long time, so start with a limit. - Optionally set filters and a Max results limit.
- Click Start. A default run finishes in under a minute.
- Open the Output tab, then download the dataset or connect it to your tools.
Input Parameters
| Parameter | Type | Required | Default | Description |
|---|---|---|---|---|
tickers | array | No | ["BHP","CBA","CSL"] | ASX codes, one per line, for example BHP, CBA, CSL. Leave empty and turn on the scan to read every listed company. |
mode | string | No | "quotes" | quotes returns one row per stock. history returns about the last month of daily bars per stock, read from a public secondary source (not the ASX's own chart feed, which needs an access token this Actor does not have). |
scanAll | boolean | No | false | Reads every company on the exchange list instead of the tickers above. Use Max rows to limit it; a full scan takes a long time. |
maxItems | integer | No | 0 | Cap on returned rows. Set 0 for no limit. |
proxyConfiguration | object | No | {"useApifyProxy":false} | Optional proxy. The data works without one. |
Output Data
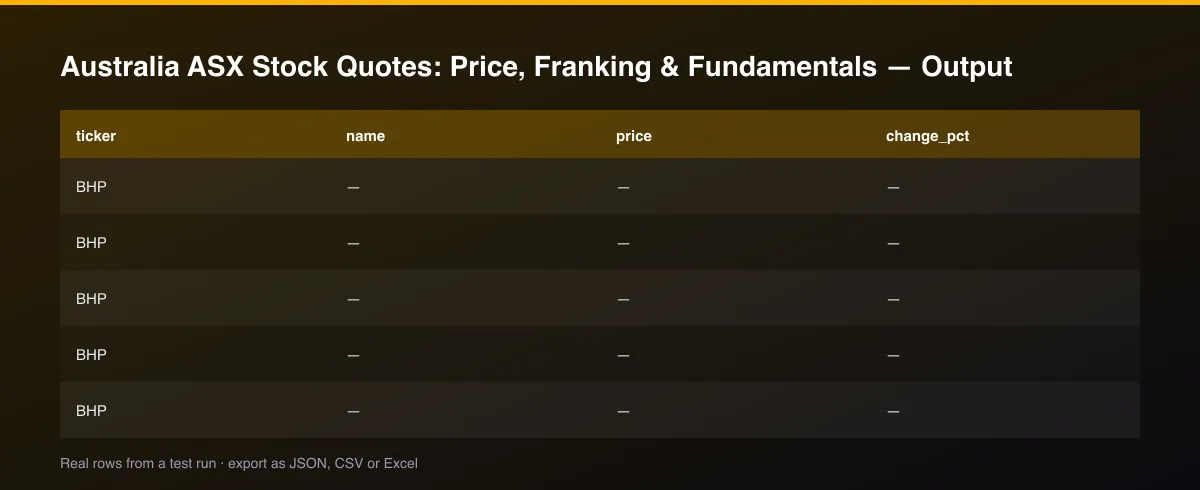
price, change_pct, previous_close, bid, ask, day_low, day_high, volume, week52_low, week52_high and range_position_52w_pct describe trading. market_cap, shares_outstanding, pe_ratio (empty when earnings are negative), eps, dividend_yield_pct, dividend_per_share, franking_pct, ex_dividend_date, free_cash_flow_yield_pct, latest_revenue and latest_net_income (in reporting_currency) describe the business. History rows (record_type: "bar") have date, open, high, low, close and volume for about the last month of trading days.
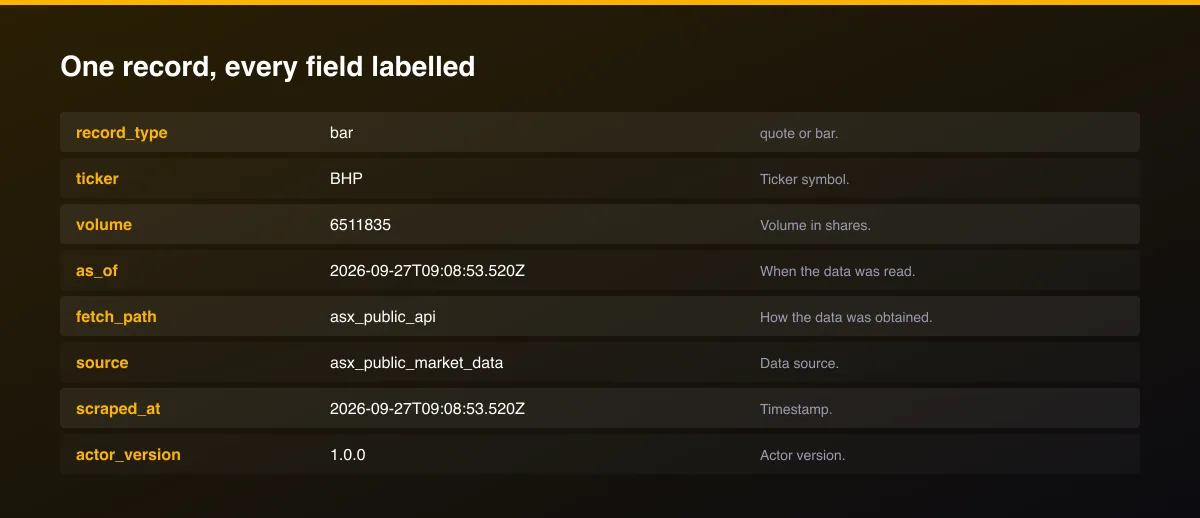
A real dataset item:
How to read and use the results
- Read price and change_pct.
- Screen on dividend_yield_pct and franking_pct for income.
- Use pe_ratio and free_cash_flow_yield_pct for value.
- Use range_position_52w_pct for momentum.
- Use scan mode for the whole market.
- Schedule runs to build history.
Usage Examples
Big ASX stocks
First 200 listed companies
Banks by franking and yield
Tips for Best Results
- Schedule the Actor after the close and keep each run to build your own price history.
- range_position_52w_pct is 0 at the 52-week low and 100 at the high, a quick momentum and mean-reversion feature.
- Keep tickers in one run: many tickers per run cost less than many runs.
- Sort by dividend_yield_pct and franking_pct for income screens.
- For a full-market scan, run it on a schedule outside trading hours.
- Default is 5 results for a fast test. Set the max to 0 to return everything available.
Reliability by mode
| Mode | Status | Needs login or key? | Notes |
|---|---|---|---|
| Quotes for listed codes | ✅ | No | Public ASX market data. |
| Franking, yield, P/E, EPS | 🟡 | No | Present for most operating companies. |
| Daily price history (about 1 month) | 🟡 | No | From a public secondary source (Google Finance's own chart data), not the exchange's own feed. |
| Real-time tick data | ❌ | - | End-of-day and delayed snapshots. |
✅ works as described, 🟡 works with caveats, ❌ not supported.
Known Limitations
- This Actor returns quotes only; daily history is not available from the public ASX data it reads.
- Prices are delayed exchange data, not real-time ticks.
- Fundamentals are as published by the exchange data provider and may lag results.
- Some small securities have no key statistics; those fields are empty.
- This is information, not financial advice.
- Daily bars are read from Google Finance's own embedded chart data, a secondary source; treat the most recent day's close as provisional and prefer the quote row for the current price.
Integrations
Run it from the Apify API, on a schedule, or from a webhook. Send results straight to Google Sheets, Make, Zapier, Slack or your own database with Apify's built-in integrations.
Export Formats
Download the dataset as JSON, CSV, Excel, XML, HTML table or RSS from the Output tab or the API.
Frequently Asked Questions
Where does the data come from?
Public ASX market data and the exchange list of listed companies.
Does it need an API key or account?
No.
Can I get daily price history?
Yes, switch Mode to history for about the last month of daily bars, read from a public secondary source since the exchange's own chart feed needs an access token this Actor does not have.
How fresh are the prices?
Quotes are delayed exchange data.
What if a ticker is wrong?
It is skipped and named in the log; the other tickers still return.
Can I run it on a schedule?
Yes. Schedule it and store each run to build your own price history.
Am I charged for tickers that return nothing?
No, only for rows returned.
Do I need an account or login?
No. The Actor reads public ASX market data and needs no account or API key.
Am I charged for failed runs or empty results?
You are only charged for results that are actually written to the dataset.
Can I run it on a schedule?
Yes. Create a Task with your input and add a schedule in Apify Console. With monitor mode on, each scheduled run returns only what changed since the previous one.
Changelog
- 2026-09-27: First release.
Enterprise and custom work
Need higher volumes, a custom output schema, dedicated scheduling or a no-breaking-changes commitment for a production pipeline? Open an issue on the Actor page and describe your use case. Bulk terms and custom builds are available.
Support
Questions or a missing field? Open an issue from the Issues tab on this Actor's page and it will be looked at.
Legal / Responsible Use
This Actor reads publicly available ASX market data. You are responsible for how you use it and for complying with the source's terms. It is not financial advice and not affiliated with ASX.


