

Neighborhood Livability Digest
Pricing
from $2.56 / 1,000 results
Neighborhood Livability Digest
Combine real crime-incident activity, the closest public schools, and a computed walkability score for one address into a single plain-language neighborhood livability report.
Pricing
from $2.56 / 1,000 results
Rating
0.0
(0)
Developer

MrDoe
Maintained by CommunityActor stats
0
Bookmarked
2
Total users
1
Monthly active users
3 days ago
Last modified
Categories
Share
What does Neighborhood Livability Digest do?
Neighborhood Livability Digest takes a single street address and combines three real public signals into one plain-language report: recent crime-incident activity nearby, the closest public schools with real distances, and a computed walkability score built from nearby grocery stores, restaurants, transit stops, and parks. Instead of opening three different sites and cross-referencing them yourself, you get one written read on the area plus the underlying numbers behind it.
It is built for home buyers and renters sizing up a neighborhood, relocation researchers comparing a shortlist of addresses, and real estate agents putting together a quick area brief for a client.
Why use Neighborhood Livability Digest?
- Three real signals in one place - crime activity, nearby schools, and walkability, not just one.
- Honest about limits - crime is reported as raw incident volume for the chosen radius and lookback window, never dressed up as a normalized "safety score" that can't be fairly compared city to city.
- No invented ratings - schools are listed with real names, addresses, and distances; no school-rating number is fabricated.
- A documented walkability formula - built from real nearby amenity counts, not a black-box or licensed score.
- One written summary - a plain-language read of what the numbers mean together, plus who the area suits and what to watch for.
- Multiple addresses per run - check a shortlist in one go.
What makes this different
Most "neighborhood data" tools either sell you a single proprietary score with no visibility into how it was built, or make you visit crime maps, school-district sites, and walkability tools separately and do the synthesis yourself. This Actor pulls real, current data for all three signals for the exact address you give it, computes an honest, documented walkability index instead of a black-box score, and writes one combined read of the area - including calling out when the data is thin so you know when to dig further yourself.
How it works

- Your input - one or more addresses in a supported city.
- The Actor gathers it - recent crime incidents near the address, the closest public schools, and nearby walkable amenities.
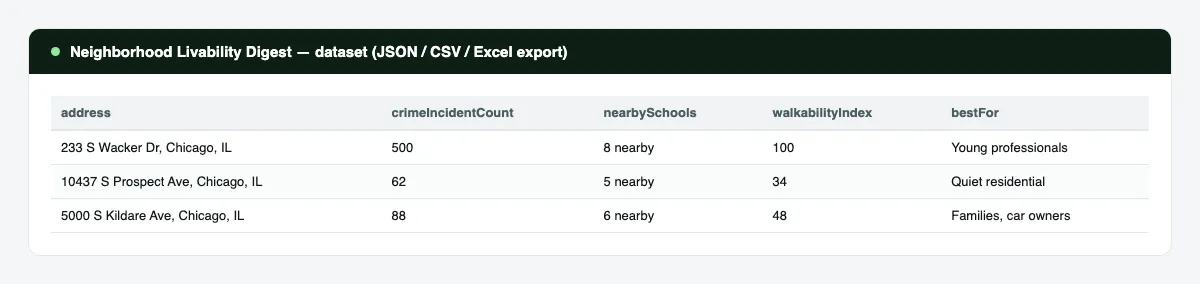
- Your output - one dataset row per address: the real numbers plus a written summary of what they mean together. Export to JSON, CSV, or Excel.
What data can you extract?
| Field | Description |
|---|---|
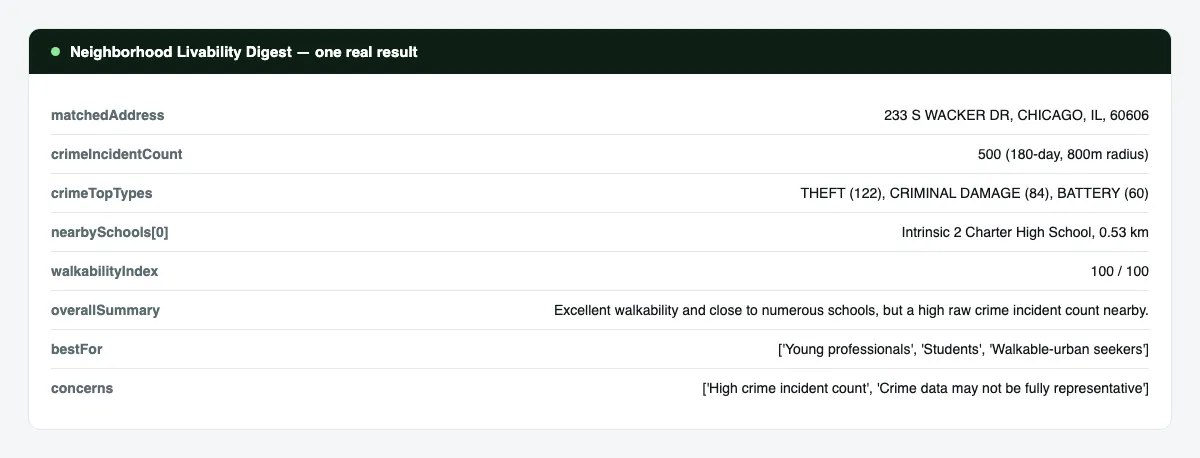
address / matchedAddress | The address you gave, and how it resolved. |
latitude / longitude | The resolved coordinates. |
crimeIncidentCount | Real incident count within the radius and lookback window. |
crimeIncidentsPerSqKmPerYear | The same count, normalized to an annualized rate per square kilometer. |
crimeTopTypes | The most common incident types nearby, with counts. |
crimeMostRecentDate | The date of the most recent incident in the feed. |
nearbySchools | Real nearby public schools: name, address, distance - no ratings. |
walkabilityIndex | A 0-100 score computed from nearby amenity counts. |
walkabilityBreakdown | The amenity counts and points behind the walkability score. |
overallSummary | A plain-language read combining all three signals. |
crimeRead / schoolsRead / walkabilityRead | A written explanation of each signal. |
bestFor | Who the area suits, grounded in the real data. |
concerns | Honest caveats about thin data or notable numbers. |
enrichmentConfidence | How confident the written read is: high, medium, or low. |
enrichmentStatus | Whether the written read was produced, and if not, why. |
scrapedAt | ISO timestamp of the run. |
How to use Neighborhood Livability Digest
- Open the Actor in the Apify Console.
- In Addresses, list one or more street addresses.
- Set City to the metro area those addresses are in.
- Adjust the crime radius, school radius, and lookback window if you want a wider or tighter view.
- Press Start.
- When the run finishes, open the Dataset tab and export to CSV, JSON, or Excel.
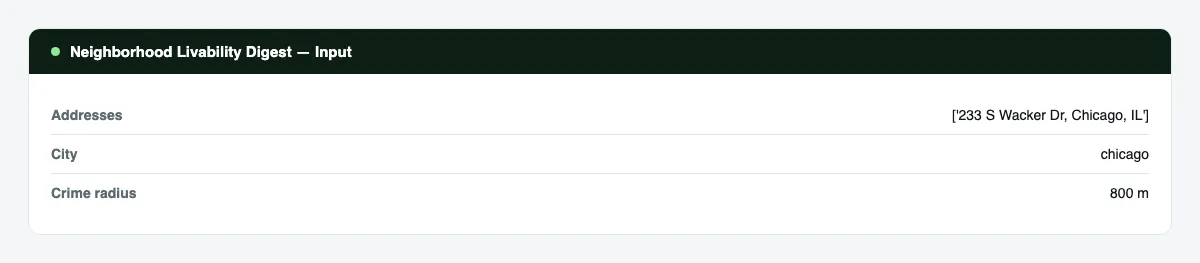
Input Parameters
| Parameter | Type | Required | Default | Description |
|---|---|---|---|---|
addresses | array of string | Yes | one example address per city | Street addresses to look up. |
city | string | Yes | chicago | The metro area the addresses are in. |
radiusMeters | integer | No | 800 | Radius for crime and walkability lookups, in meters. Range 300-2000. |
schoolRadiusMeters | integer | No | 3200 | Radius for nearby-school lookups, in meters. Range 1000-8000. |
crimeLookbackDays | integer | No | 180 | How many days of crime history to pull. Range 30-365. |
maxSchools | integer | No | 8 | Maximum nearby schools to return. Range 3-15. |
openRouterApiKey | string (secret) | No | - | Optional key for the written summary. Without it, only the raw numbers are returned. |
proxyConfiguration | object | Yes | Apify Proxy | Proxy settings. A proxy is required; the default uses Apify Proxy. |
Output Data
One dataset item per address. Real sample record:
Usage Examples
- Home shortlist - run every address on your shortlist in one batch and compare side by side.
- Relocation research - check a handful of candidate neighborhoods in a city before booking a visit.
- Client briefing - pull a quick, honest area summary for a buyer or renter.
- Portfolio review - property managers checking how the immediate area around a listing reads today.
Tips for Best Results
- Use a full street address with city and state for the most reliable match.
- Widen
radiusMetersfor a more area-wide read, or tighten it for a block-level read. - Compare the
walkabilityBreakdownacross addresses, not just the single index number, to see which amenity types drive the score. - Treat
crimeIncidentsPerSqKmPerYearas the number to compare between your own addresses - the rawcrimeIncidentCountdepends on your chosen radius and window.
Known Limitations
- Coverage is limited to the cities listed in the input schema; support depends on each city publishing an open, queryable crime feed.
- Crime figures are raw public incident reports for the radius and window you choose, not a normalized safety score - they should not be compared directly across different cities or radii.
- School data lists nearby public schools only, with no rating - private schools and school quality are not covered.
- The written summary quality reflects the default no-cost model and should be read alongside the real numbers, not in place of them.
Integrations
Connect the dataset to Google Sheets, Airtable, Make, Zapier, or n8n; call the Actor from the Apify API; trigger it with webhooks; or schedule recurring runs from the Apify Console.
Export Formats
JSON, CSV, Excel, and XML, from the Dataset tab or the Apify API.
Frequently Asked Questions
What cities are supported?
Chicago, Los Angeles, and San Francisco at launch - see the City field in the Console for the current list.
Is the crime number a safety score?
No. It's the real, raw incident count for the radius and time window you chose, plus the same count normalized to incidents per square kilometer per year so you can compare your own addresses fairly. It is not a branded safety rating and should not be compared across different cities.
Does it rate schools?
No. It lists real nearby public schools with their name, address, and distance - no rating is invented or implied.
How is walkability calculated?
From real counts of nearby groceries, restaurants and cafes, transit stops, and parks, each contributing points up to a documented cap. The full breakdown is in every output row.
Can it run without a summary?
Yes. Without a key for the written-summary step, you still get every real number - the summary fields are simply left blank.
Can it export to Google Sheets?
Yes. Connect the dataset to the Google Sheets integration or pull it from the API.
Support
Questions and bug reports: use the Issues tab on the Actor's Console page. Include the input you ran and the run ID.
Legal / Responsible Use
Crime and school data are drawn from public government sources; this Actor does not alter or interpret them beyond straightforward counting, distance, and the plain-language summary. You are responsible for complying with the terms of use of any downstream service you send this data to, and for using crime and school proximity data responsibly and without discriminatory intent.


