

Short Interest & Squeeze Candidate Screener (FINRA Data)
Pricing
from $1.00 / 1,000 ticker returneds
Short Interest & Squeeze Candidate Screener (FINRA Data)
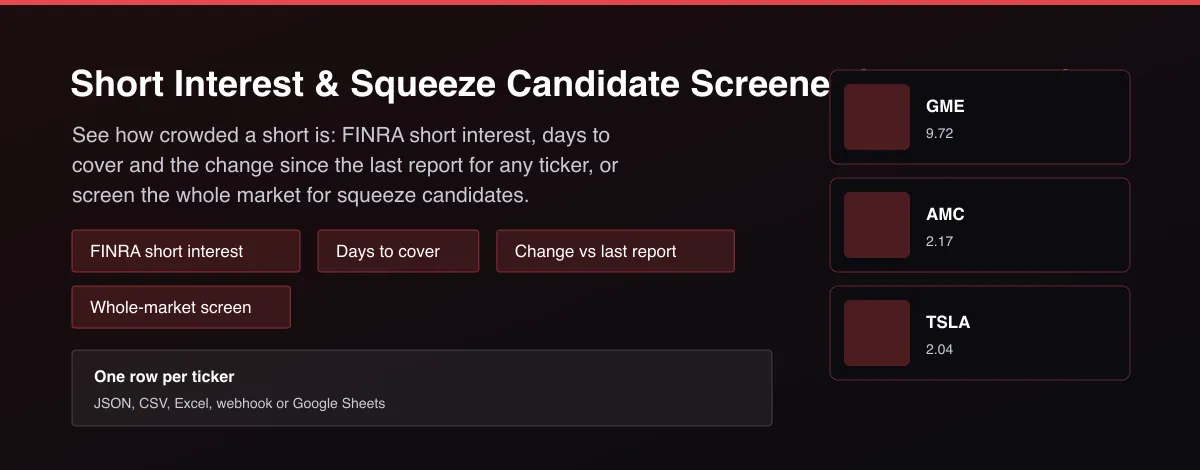
FINRA short interest for any ticker or the whole market: short % of shares, days to cover, change since the last report and squeeze-candidate filters. Official twice-monthly data. No key.

What does Short Interest & Squeeze Candidate Screener (FINRA Data) do?
Short Interest & Squeeze Candidate Screener returns the official FINRA short interest for the tickers you give it, or for the most crowded shorts in the whole market. Each row has the short interest in shares, days to cover, short interest as a percent of shares outstanding, the change since the prior report and the report date. FINRA publishes the data twice a month. Filter by minimum short percent and minimum days to cover to build a squeeze-candidate list.
Why use Short Interest & Squeeze Candidate Screener (FINRA Data)?
- Official FINRA short interest, the same data brokers quote.
- Days to cover and change since the last report are included, not just the raw count.
- Screen the whole market or watch a list of tickers in one run.
- Delta mode delivers each new twice-monthly report once.
- No account or API key.
What makes this different
Most short interest tools show one ticker at a time or hide the screen behind a subscription. This Actor returns FINRA's official numbers in bulk, adds short percent of shares outstanding from SEC filings, and lets you filter a whole-market screen by days to cover and short percent.
Who can use the Short Interest Screener and how?
- Short squeeze hunters: list crowded shorts by days to cover and short percent.
- Retail traders: check how heavily a stock you hold or watch is shorted, and whether shorts are growing.
- Quant teams: add short interest and its change as model features with a clean twice-monthly history.
- Newsletter writers: publish the most crowded shorts every report.
- Risk managers: watch short pressure in portfolio names.
- Fintech developers: power a short interest widget through the API.
- Journalists: source and cite official short interest for a story.
- Analysts: compare crowding across sectors or lists of tickers.
How it works
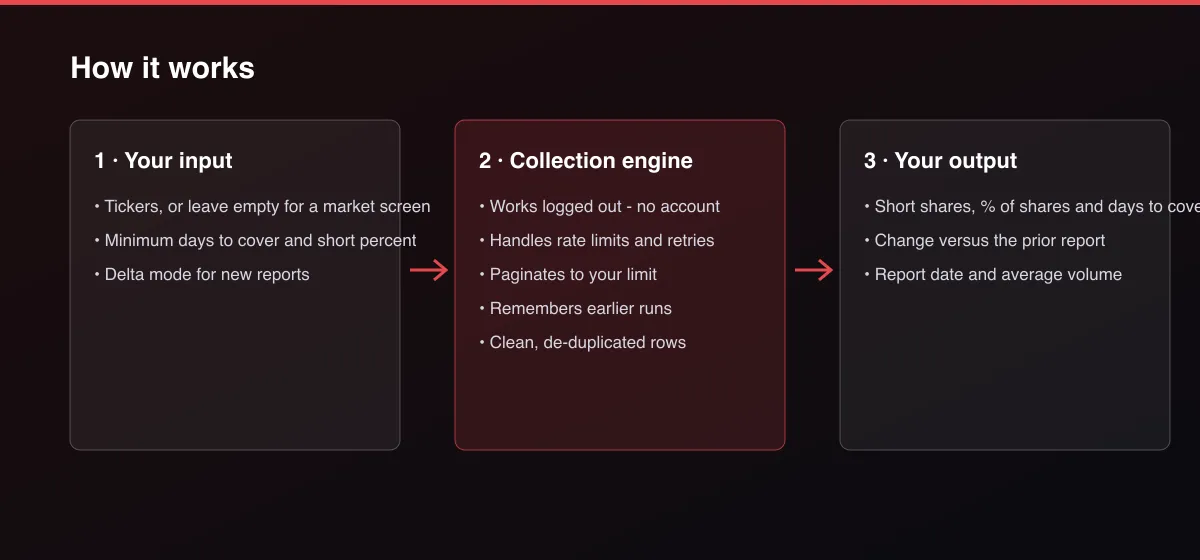
- Your input — enter tickers, or leave them empty and set minimum days to cover for a market screen.
- The Actor collects it — the Actor reads FINRA's latest short interest file and matches shares outstanding from SEC filings.
- Your output — you get one row per ticker with short percent, days to cover and the change.
What data can you extract?
The dataset has 16 fields per row:
| Field | Type | Description |
|---|---|---|
ticker | string | Stock ticker. |
issue_name | string | Company or issue name from FINRA. |
exchange | string | Market class reported by FINRA. |
short_pct_float | number | Short interest as a percent of shares outstanding (see float_basis). |
float_basis | string | shares_outstanding when the percent uses SEC shares outstanding. |
days_to_cover | number | Short interest divided by average daily volume, from FINRA. |
short_interest_shares | number | Shares sold short at the report date. |
prior_short_interest_shares | number | Shares sold short at the previous report. |
report_date | string | FINRA settlement date (YYYY-MM-DD). |
change_from_prior_report_pct | number | Change since the previous report in percent. |
average_daily_volume | number | Average daily volume used by FINRA. |
shares_outstanding | number | Shares outstanding from the latest SEC filing. |
fetch_path | string | How the row was read: finra_file. |
source | string | Data source. |
scraped_at | string | Collection time (ISO 8601). |
actor_version | string | Output schema version. |
How to use Short Interest & Squeeze Candidate Screener (FINRA Data)
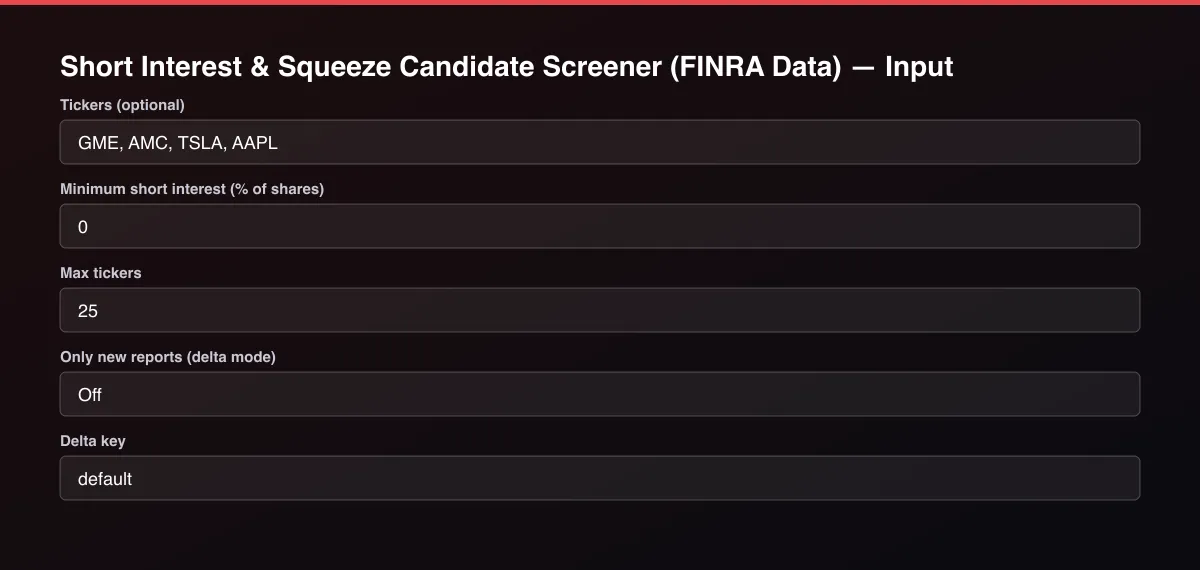
- Open the Actor and go to the Input tab.
- Enter Tickers for a lookup, or leave them empty and set Minimum days to cover and Minimum short interest for a whole-market screen.
- Optionally set filters and a Max results limit.
- Click Start. A default run finishes in under a minute.
- Open the Output tab, then download the dataset or connect it to your tools.
Input Parameters
| Parameter | Type | Required | Default | Description |
|---|---|---|---|---|
tickers | array | No | [] | Stock tickers to look up, one per line. Leave empty to screen the whole market for crowded shorts. |
minShortPctFloat | number | No | 0 | Only return tickers with at least this short interest as a percent of shares outstanding. |
minDaysToCover | number | No | — | Only return tickers with at least this many days to cover. Defaults to 5 for a market screen and 0 for a ticker list. |
maxItems | integer | No | 25 | Maximum number of tickers returned. Set 0 for no limit. |
deltaMode | boolean | No | false | Return and bill only tickers from a report not delivered by an earlier run with the same delta key. FINRA publishes twice a month. |
deltaStateKey | string | No | "default" | Name of the tracked stream. |
proxyConfiguration | object | No | {"useApifyProxy":false} | Optional proxy. FINRA and SEC files work without one. |
Output Data
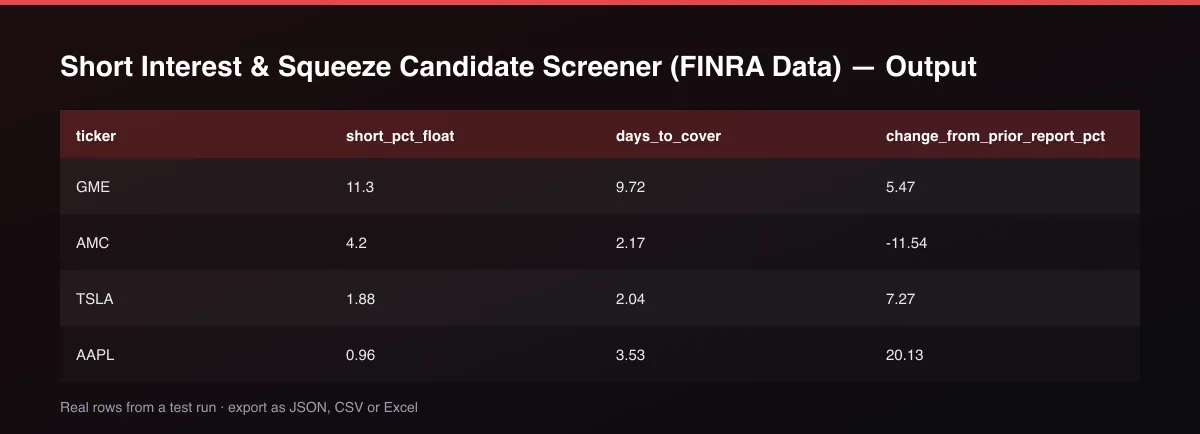
short_interest_shares is the shares sold short at report_date (the FINRA settlement date). days_to_cover is short interest divided by average daily volume, as published by FINRA. short_pct_float is short interest as a percent of shares outstanding from the company's latest SEC cover page; the basis is stated in float_basis because the exact free float is not available from official sources. change_from_prior_report_pct compares with the previous FINRA report.
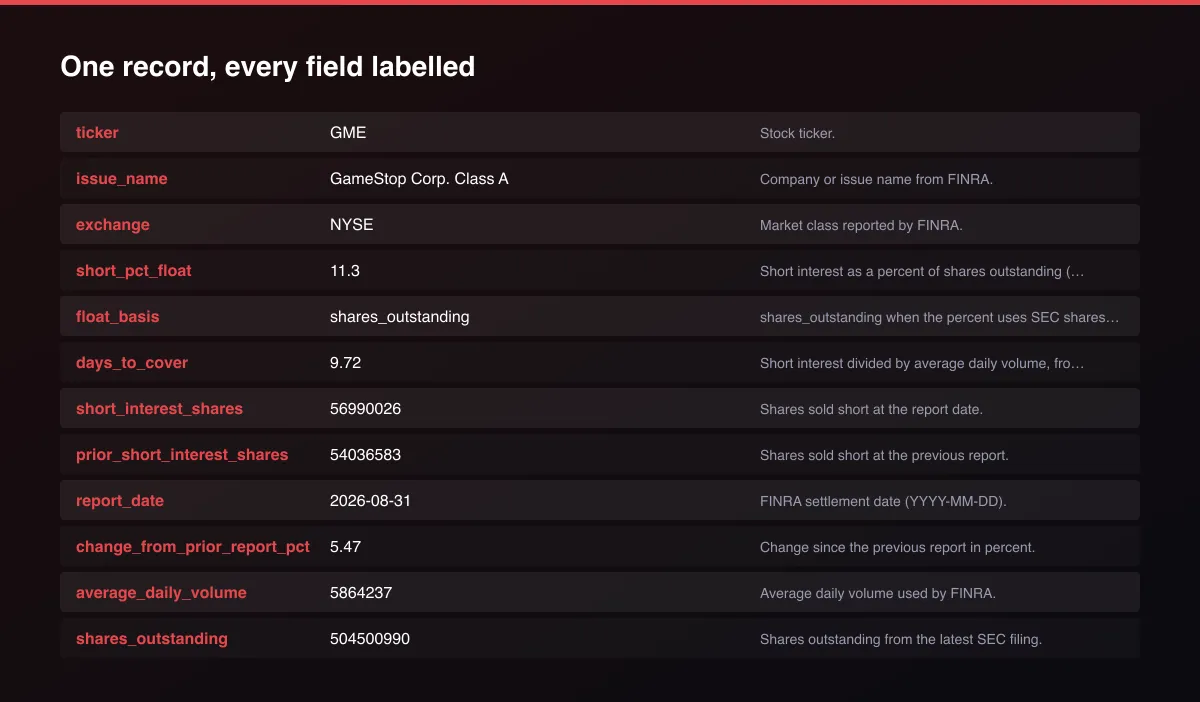
A real dataset item:
How to read and use the results
- Sort by days_to_cover for the hardest shorts to unwind.
- Check short_pct_float for how much of the company is sold short.
- Watch change_from_prior_report_pct for shorts building or covering.
- Read report_date: the data is as of that settlement date.
- Combine with insider buying or news before drawing conclusions.
- Automate with delta mode and a twice-monthly schedule.
Usage Examples
Look up a few tickers
Market screen for crowded shorts
Only tickers from a new report
Tips for Best Results
- Short interest alone shows crowding, not a catalyst. Combine it with insider buying, news or volume for a real signal.
- Reports come out about eight business days after each settlement date, twice a month.
- Use delta mode on a schedule to get each report once.
- A high days to cover with a small position can be noise; check short_interest_shares too.
- Default is 5 results for a fast test. Set the max to 0 to return everything available.
Reliability by mode
| Mode | Status | Needs login or key? | Notes |
|---|---|---|---|
| Ticker lookup | ✅ | No | FINRA file plus SEC shares outstanding. |
| Whole-market screen | 🟡 | No | Top 300 candidates by days to cover per run. |
| Change vs prior report | ✅ | No | Provided by FINRA in the same file. |
| Exact free float | ❌ | - | Shares outstanding is used; float is not published officially. |
| Real-time short interest | ❌ | - | FINRA reports twice a month. |
✅ works as described, 🟡 works with caveats, ❌ not supported.
Only new records (delta mode)
Turn on Only new reports (delta mode) and set a Delta key. Schedule the Actor weekly; each run returns, and bills, only tickers from a FINRA report that earlier runs of that key have not delivered.
Known Limitations
- FINRA publishes short interest only twice a month, so the data is not real-time and lags settlement by about a week.
- Short percent uses shares outstanding from the latest SEC filing, not the exact free float, so it understates crowding for stocks with large insider holdings.
- Market screens read shares outstanding for the top 300 candidates by days to cover, so a very long list needs several runs.
- Only exchange-listed and OTC symbols in the FINRA report are covered; tickers with no reported position are skipped with a warning.
- Short interest alone is not a squeeze predictor; it says who is crowded, not what will trigger a rally.
Integrations
Run it from the Apify API, on a schedule, or from a webhook. Send results straight to Google Sheets, Make, Zapier, Slack or your own database with Apify's built-in integrations.
Export Formats
Download the dataset as JSON, CSV, Excel, XML, HTML table or RSS from the Output tab or the API.
Frequently Asked Questions
Where does the data come from?
FINRA's official biweekly short interest files for the position, days to cover and change, and SEC company filings for shares outstanding. Both are official public sources.
Does it need an API key?
No.
How often does short interest update?
Twice a month, on FINRA's settlement dates (mid month and month end), published about a week later.
What is days to cover?
Short interest divided by average daily trading volume: how many days of normal volume it would take shorts to buy back their position.
Is a high short interest a squeeze signal?
No, on its own it is crowding. Squeezes need a catalyst; combine it with other signals.
Am I charged for failed results?
No. You are only charged for tickers written to the dataset.
Do I need an account or login?
No. The Actor reads public FINRA and SEC data and needs no account or API key.
Am I charged for failed runs or empty results?
You are only charged for results that are actually written to the dataset.
Can I run it on a schedule?
Yes. Create a Task with your input and add a schedule in Apify Console. With monitor mode on, each scheduled run returns only what changed since the previous one.
Changelog
- 2026-09-26: First release: FINRA short interest lookup and market screen with days to cover, change and delta mode.
Enterprise and custom work
Need higher volumes, a custom output schema, dedicated scheduling or a no-breaking-changes commitment for a production pipeline? Open an issue on the Actor page and describe your use case. Bulk terms and custom builds are available.
Support
Questions or a missing field? Open an issue from the Issues tab on this Actor's page and it will be looked at.
Legal / Responsible Use
This Actor reads public data published by FINRA and the SEC. You are responsible for how you use it. It is not investment advice and is not affiliated with FINRA or the SEC.


