

US Options Sentiment Scanner: Put/Call, Skew & Implied Move
Pricing
from $3.00 / 1,000 ticker returneds
US Options Sentiment Scanner: Put/Call, Skew & Implied Move
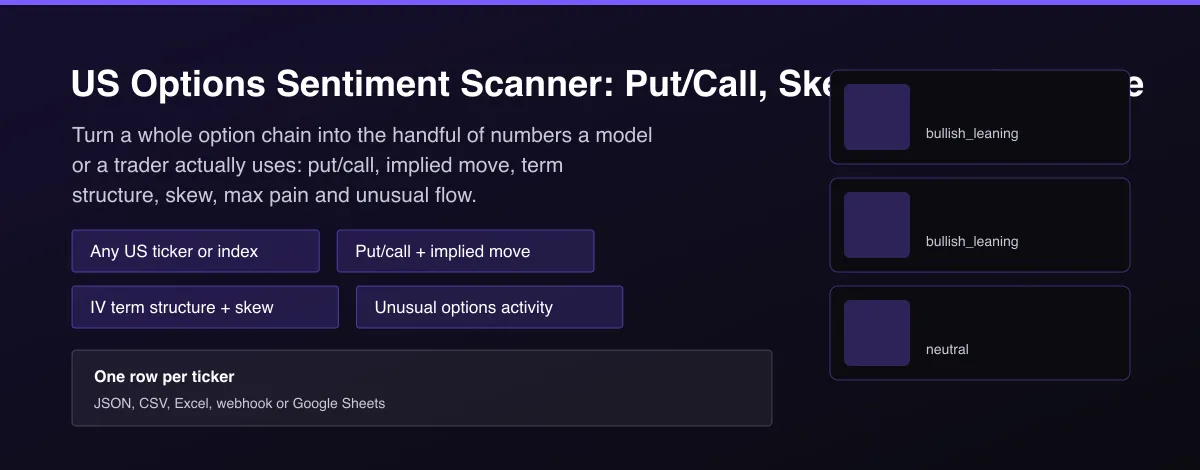
Options positioning features for any US stock, ETF or index: put/call ratios, implied move, IV term structure, 25-delta skew, max pain and unusual contract activity. One clean row per ticker for models and screens.

What does US Options Sentiment Scanner: Put/Call, Skew & Implied Move do?
US Options Sentiment Scanner condenses the full delayed option chain of any US stock, ETF or index into one row of positioning features. For each ticker it returns put/call ratios by volume and by open interest, the implied move from the at-the-money straddle for the nearest and the roughly 30-day expiry, the implied volatility term structure at about 7, 30, 60 and 90 days, the 25-delta skew, max pain for the nearest expiry, the strikes with the most open interest and the largest unusual contracts by volume against open interest. Quotes are delayed exchange data, so it suits daily models, screens and reports rather than tick trading.
Why use US Options Sentiment Scanner: Put/Call, Skew & Implied Move?
- Model-ready: the chain is already reduced to numbers you can join to prices, with the source timestamp on every row.
- Covers what retail tools hide: term structure, 25-delta skew and implied move in one place.
- Unusual activity is ranked by premium, so the biggest trades surface first.
- Works for stocks, ETFs and indices such as SPY and the S&P 500 index.
- Bulk by design: dozens of tickers per run and billed only for tickers returned. No API key or login.
What makes this different
Options analytics sit behind expensive terminals and per-seat data plans. This Actor gives you the derived positioning features on demand, without you downloading and processing multi-megabyte chains, so a predictor, alert or newsletter can use them in minutes.
Who can use the US Options Sentiment Scanner and how?
- Quant researchers and predictors: build put/call, skew and term-structure features to join with price data.
- Retail and swing traders: screen a watchlist for unusual options activity and rich or cheap implied volatility.
- Earnings traders: see the implied move before a report.
- Newsletter writers: publish a daily options sentiment table.
- Fintech apps: show options positioning beside a stock quote.
- Risk teams: track index skew and term-structure inversion as a stress gauge.
- AI agent builders: let an assistant answer what the options market implies for a ticker.
- Educators and students: study how positioning and volatility relate to price moves.
How it works
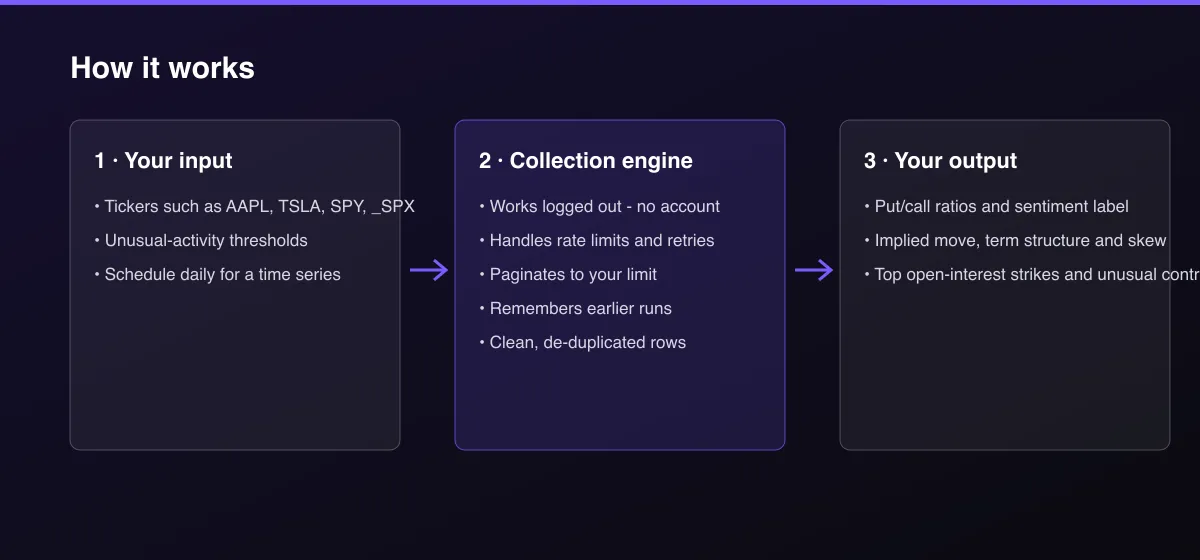
- Your input — list the tickers you care about.
- The Actor collects it — the Actor reads each ticker's delayed option chain and computes the features.
- Your output — you get one row per ticker; schedule it daily to build your own history.
What data can you extract?
The dataset has 29 fields per row:
| Field | Type | Description |
|---|---|---|
ticker | string | Ticker as requested. |
underlying | string | Symbol reported by the exchange. |
price | number | Underlying price. |
price_change_pct | number | Day price change percent. |
iv30_pct | number | 30-day implied volatility (exchange index), percent. |
iv30_change_pct | number | Change in iv30, percent points. |
put_call_volume_ratio | number | Put volume divided by call volume, all expiries. |
put_call_open_interest_ratio | number | Put open interest divided by call open interest. |
sentiment | string | bullish_leaning, neutral or bearish_leaning from put/call volume. |
call_volume | integer | Total call volume. |
put_volume | integer | Total put volume. |
call_open_interest | integer | Total call open interest. |
put_open_interest | integer | Total put open interest. |
expiries_count | integer | Number of listed expiries. |
nearest_expiry | string | Nearest expiry at least one day out. |
implied_move_nearest_expiry_pct | number | ATM straddle as percent of price, nearest expiry. |
implied_move_30d_pct | number | ATM straddle as percent of price, about 30 days. |
iv_term_structure | object | ATM implied volatility at about 7, 30, 60, 90 days. |
term_structure_shape | string | contango, flat or inverted. |
skew_25d_30d_pts | number | Put IV minus call IV at 25 delta, about 30 days, in vol points. |
max_pain_nearest_expiry | number | Max pain strike of the nearest expiry. |
top_call_open_interest_30d | array | Call strikes with most open interest, about 30 days. |
top_put_open_interest_30d | array | Put strikes with most open interest, about 30 days. |
unusual_activity | array | Contracts with unusual volume, largest premium first. |
data_as_of | string | Exchange timestamp of the quotes. |
fetch_path | string | How the data was obtained. |
source | string | Data source. |
scraped_at | string | Timestamp. |
actor_version | string | Actor version. |
How to use US Options Sentiment Scanner: Put/Call, Skew & Implied Move
- Open the Actor and go to the Input tab.
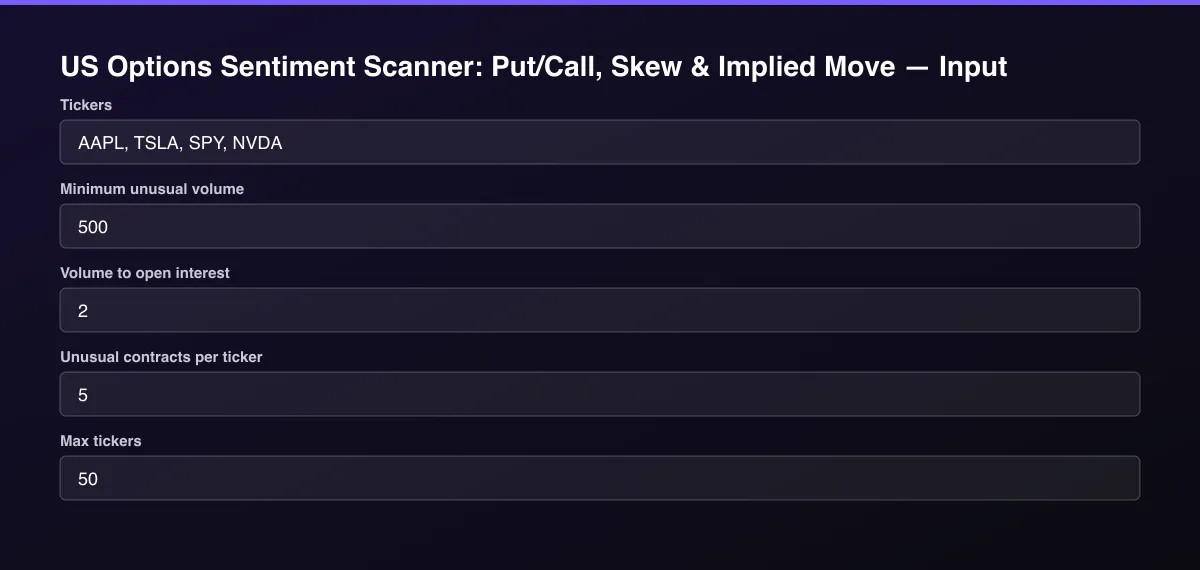
- Enter Tickers (for example
AAPL,TSLA,SPY; use_SPXfor the S&P 500 index) and run. Tune Minimum unusual volume and Volume to open interest to control which contracts count as unusual. Schedule the Actor after the US close and store each day's rows to build a history for backtests. - Optionally set filters and a Max results limit.
- Click Start. A default run finishes in under a minute.
- Open the Output tab, then download the dataset or connect it to your tools.
Input Parameters
| Parameter | Type | Required | Default | Description |
|---|---|---|---|---|
tickers | array | No | [] | US stock, ETF or index symbols, one per line, for example AAPL, TSLA, SPY. Use an underscore for indices, for example _SPX or _VIX. |
minUnusualVolume | integer | No | 500 | A contract needs at least this much volume to count as unusual. |
unusualVolumeToOi | number | No | 2 | A contract counts as unusual when its volume is at least this multiple of its open interest. |
topUnusual | integer | No | 5 | How many unusual contracts to list per ticker, largest premium first. |
maxItems | integer | No | 50 | Cap on tickers processed. Set 0 for no limit. |
proxyConfiguration | object | No | {"useApifyProxy":false} | Optional proxy. The delayed quotes work without one. |
Output Data
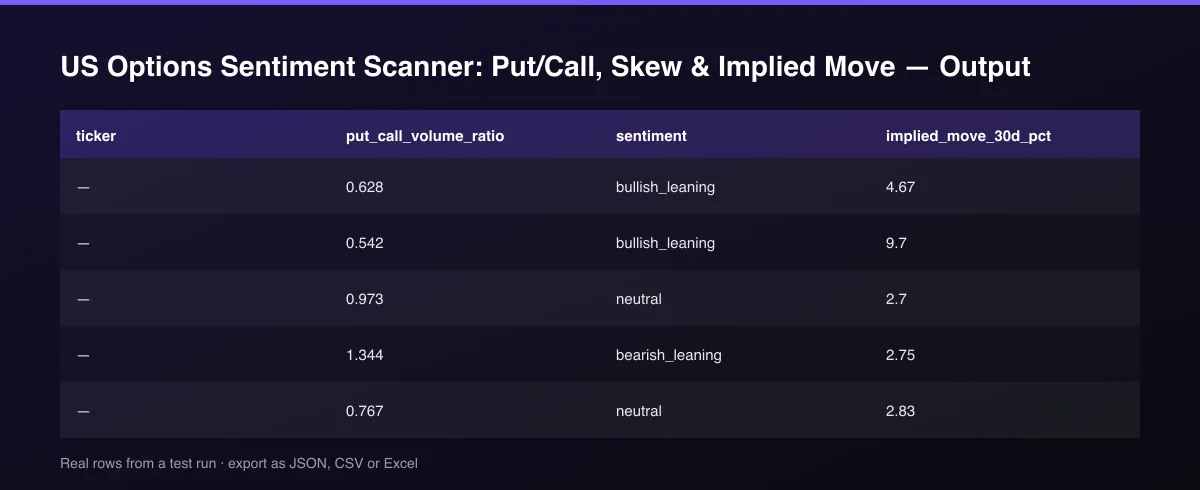
put_call_volume_ratio above 1 means more put than call volume; sentiment labels it bullish_leaning (<0.7), neutral or bearish_leaning (>1.0). implied_move_*_pct is the at-the-money straddle price as a percent of the stock price. iv_term_structure lists ATM implied volatility at about 7, 30, 60 and 90 days, and term_structure_shape is inverted when near-term IV is clearly above the two-month IV. skew_25d_30d_pts is put IV minus call IV at about 25 delta: positive means downside protection is priced richer. unusual_activity lists contracts with large volume relative to open interest, largest premium first.
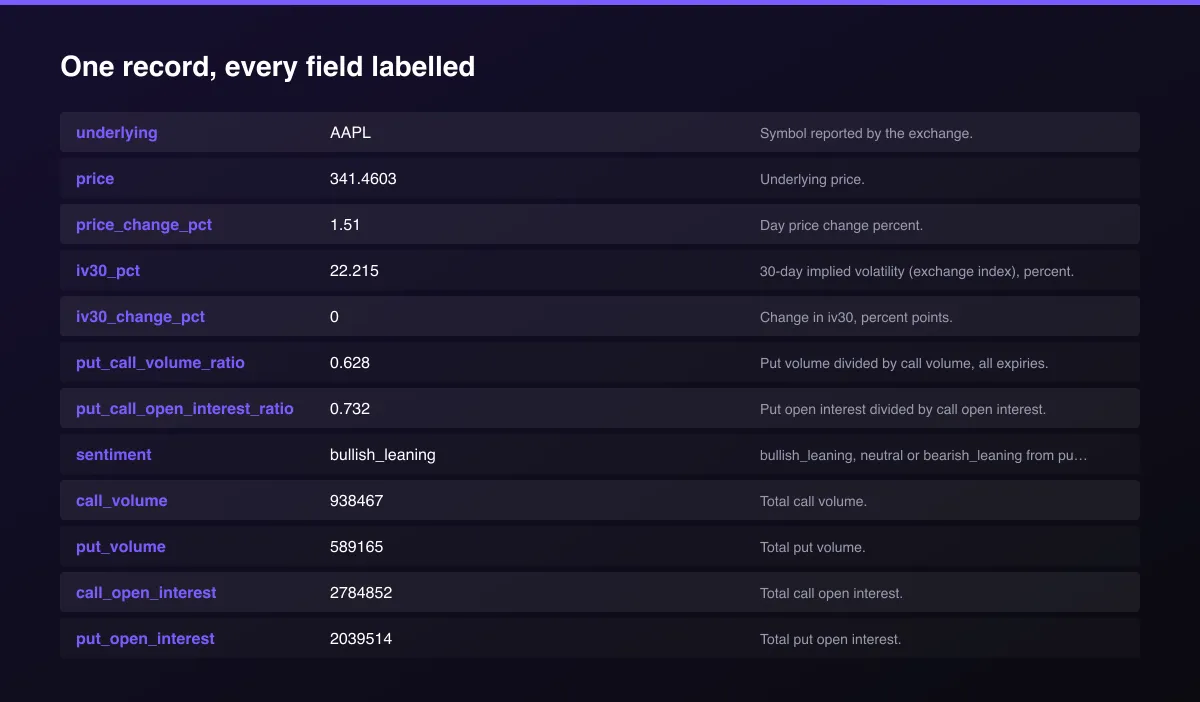
A real dataset item:
How to read and use the results
- Read sentiment and put_call_volume_ratio for the day's positioning.
- Compare implied_move_30d_pct with realised moves to judge whether options are rich or cheap.
- Check term_structure_shape: inverted means near-term stress.
- Read skew_25d_30d_pts for the price of downside protection.
- Scan unusual_activity for large, aggressive contracts.
- Store rows daily to compare with the ticker's own history.
Usage Examples
Mega-cap tech
Index and ETF risk gauge
Stricter unusual-flow filter
Tips for Best Results
- Store each day's rows: put/call and skew are most useful as changes against their own history.
- Treat sentiment as a positioning descriptor, not a forecast; heavy put buying is often hedging.
- implied_move_nearest_expiry_pct around earnings shows how much the market expects the stock to move.
- Read unusual_activity together with days_to_expiry: short-dated large trades are often hedges or spreads.
- Run after the US close; outside market hours the data is the last session's.
- Default is 5 results for a fast test. Set the max to 0 to return everything available.
Reliability by mode
| Mode | Status | Needs login or key? | Notes |
|---|---|---|---|
| Large liquid tickers (AAPL, TSLA, SPY) | ✅ | No | Full chains with implied volatility and greeks. |
| Index options (_SPX, _VIX) | ✅ | No | Use the underscore prefix. |
| Illiquid small caps | 🟡 | No | Thin chains give noisy IV and skew. |
| Tickers without listed options | ❌ | - | Named in the log, not returned. |
| Real-time quotes | ❌ | - | Delayed data only. |
✅ works as described, 🟡 works with caveats, ❌ not supported.
Known Limitations
- Quotes are delayed exchange data, not real time, and outside market hours the data is from the last session.
- Only listed US options underlyings are covered; tickers without listed options return no row and are named in the log.
- Volume and open interest are aggregated over all expiries listed; open interest updates once a day.
- Unusual activity cannot tell whether a trade was buying or selling, or part of a spread.
- Implied volatility figures come from the source and can be unreliable for illiquid, deep out-of-the-money contracts; at-the-money values are used for the summary.
- This is information, not financial advice.
Integrations
Run it from the Apify API, on a schedule, or from a webhook. Send results straight to Google Sheets, Make, Zapier, Slack or your own database with Apify's built-in integrations.
Export Formats
Download the dataset as JSON, CSV, Excel, XML, HTML table or RSS from the Output tab or the API.
Frequently Asked Questions
Where does the data come from?
From the delayed public option quote data that the Cboe exchange publishes for listed US options.
How delayed is it?
The quotes are delayed by at least 15 minutes during market hours, and after hours they reflect the last session.
Does it need an API key or account?
No.
Can I get the raw option chain?
No. The Actor returns derived features; the raw chain is several megabytes per ticker.
What is _SPX?
The S&P 500 index option chain. Use an underscore before index symbols, for example _SPX or _VIX.
Am I charged for tickers with no data?
No, only for tickers returned.
Do I need an account or login?
No. The Actor reads public delayed option quotes and needs no account or API key.
Am I charged for failed runs or empty results?
You are only charged for results that are actually written to the dataset.
Can I run it on a schedule?
Yes. Create a Task with your input and add a schedule in Apify Console. With monitor mode on, each scheduled run returns only what changed since the previous one.
Changelog
- 2026-09-26: First release: put/call, implied move, term structure, skew, max pain and unusual activity for any US options underlying.
Enterprise and custom work
Need higher volumes, a custom output schema, dedicated scheduling or a no-breaking-changes commitment for a production pipeline? Open an issue on the Actor page and describe your use case. Bulk terms and custom builds are available.
Support
Questions or a missing field? Open an issue from the Issues tab on this Actor's page and it will be looked at.
Legal / Responsible Use
This Actor reads publicly available delayed option quotes. You are responsible for how you use the data. It is not financial advice and not affiliated with Cboe or any exchange.


