
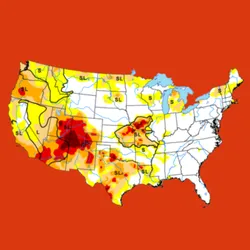
US Drought Monitor Scraper
Pricing
from $2.44 / 1,000 results
US Drought Monitor Scraper
Scrapes weekly drought coverage percentages from the US Drought Monitor for any state, county, or the entire United States. Returns one row per week with cumulative or categorical drought statistics.
Pricing
from $2.44 / 1,000 results
Rating
0.0
(0)
Developer

ParseForge
Maintained by Apify PartnerActor stats
0
Bookmarked
2
Total users
1
Monthly active users
19 days ago
Last modified
Categories
Share

US Drought Monitor Scraper
Scrape weekly US Drought Monitor statistics for any state, county, or the whole country. Get cumulative or categorical drought coverage percentages for every week in your date range. No API key. Export to CSV, JSON, Excel, or XML.
The US Drought Monitor publishes a new drought map every week, but the official website has no bulk download for historical statistics. This Actor pulls the weekly drought coverage percentages for any state, county, or the entire United States, so you can track drought conditions over time without manual copying. It reads the public statistics tables directly and returns one row per week.
| Who uses it | What they scrape US Drought Monitor for |
|---|---|
| Agricultural analysts | Track drought severity in key farming states to forecast crop yields |
| Water resource managers | Monitor drought conditions in their service area to plan water restrictions |
| Climate researchers | Build historical drought datasets for trend analysis and modeling |
| Insurance underwriters | Assess drought exposure for agricultural insurance policies |
What it does
This Actor collects weekly drought coverage percentages from the US Drought Monitor for a chosen area and date range, and returns each week as a flat row.
- 🗺️ Area selection: choose the whole US, any state, or a specific county by FIPS code
- 📅 Date range: set start and end dates, and each week in between becomes one record
- 📊 Statistics type: traditional cumulative percentages or categorical non-overlapping slices
- 🔢 Maximum records: cap the number of rows returned per run
Results export to CSV, JSON, Excel, or XML, or straight from the API.
What you can do with US Drought Monitor data
🌾 Monitor drought for crop planning.
An agricultural analyst sets the area to Iowa and a date range covering the growing season, then exports the weekly drought percentages to compare with yield data.
💧 Track water supply conditions.
A water utility manager pulls county-level drought statistics for their service area each week to decide when to trigger conservation measures.
📈 Build a drought time series.
A climate researcher collects national drought statistics from 2000 to present, then joins the rows with temperature and precipitation data for trend analysis.
🏠 Assess regional risk.
An insurance underwriter scrapes drought coverage for several western states over the last five years to adjust policy premiums by county.
Why choose this scraper
| What you get | |
|---|---|
| Weekly granularity | One row per published drought map, matching the official weekly cadence |
| Flexible geography | National, state, or county level statistics from a single input |
| Two reporting styles | Cumulative coverage (D0 includes D1-D4) or categorical non-overlapping slices |
| Historical depth | Pull any date range back to the start of the US Drought Monitor in 2000 |
How it compares
No other Store actor targets US Drought Monitor the same way, so the honest comparison is with the alternatives teams actually weigh.
| US Drought Monitor Scraper | Build it in-house | By hand | |
|---|---|---|---|
| Setup | Run it now, zero config | Days of engineering | None, but hours per pull |
| When US Drought Monitor changes | Maintained for you | You fix it | You re-learn the page |
| Proxies, retries, anti-bot | Built in | Your problem | Browser only |
| Output | Fixed JSON schema, CSV/Excel export | Whatever you build | Copy-paste |
| Cost | Pay per result | Engineering time | Analyst hours |
Configure the run
Drive the Actor with an area of interest, an optional county FIPS code, a start and end date, and choose between cumulative or categorical drought statistics. Filters run as each week is read, so only matching records reach your dataset. The Input tab lists every parameter.
A first run with the defaults:
A larger pull:
Pricing
Pay-per-result: $0.0054 per result collected. You pay only for the results written to your dataset.
| Results collected | Approximate cost |
|---|---|
| 100 results | $0.54 |
| 1,000 results | $5.40 |
| 10,000 results | $54.00 |
New Apify accounts start with $5 in free credit.
Free users
Free-plan runs return up to 10 results as a preview. Upgrade your Apify plan to collect up to 1,000,000 results per run.
Run it
- Create a free Apify account with $5 in credit.
- Open the US Drought Monitor Scraper.
- Set your inputs and any filters, then click Start.
- Export the results as CSV, Excel, JSON, or XML from the Dataset tab.
Run it programmatically through the Apify API (run-sync-get-dataset-items) or the ApifyClient for JavaScript and Python.
Use with AI agents (MCP)
Give an AI agent live access to US Drought Monitor through the Model Context Protocol. Add the Actor to Claude, Cursor, or any MCP client:
Then prompt it in plain language to run the scraper and read back the results.
Troubleshooting
Why am I getting no results?
Check that your start date is before your end date and that both are within the valid range (January 2000 to present). Also verify that the area of interest or county FIPS code is correct.
Why does the Actor return fewer records than expected?
The US Drought Monitor publishes one map per week, so a date range of one month will return about four or five records. If you set a Maximum records value lower than the number of weeks, the Actor will stop early.
Why do the percentages not add up to 100%?
If you selected Traditional (cumulative) statistics, each drought level includes the more severe levels, so the sum will exceed 100%. Switch to Categorical (non overlapping) to get percentages that add up to 100%.
Why is my county FIPS code not working?
Make sure you entered a valid 5-digit FIPS code, such as '06037' for Los Angeles County. The Area of interest must be set to the state that contains that county, but the county code will override the state selection.
FAQ
| Question | Answer |
|---|---|
| What is the US Drought Monitor? | The US Drought Monitor is a weekly map of drought conditions across the United States, produced jointly by the National Drought Mitigation Center, USDA, and NOAA. It classifies drought into five levels: D0 (abnormally dry) through D4 (exceptional drought). |
| What does the Actor return? | Each record is one week for the selected area, with fields for the date, area name, and the percentage of the area in each drought category. The exact field names are shown in the sample output below. |
| How do I get county-level data? | Set the Area of interest to the state containing the county, then enter the 5-digit county FIPS code in the County FIPS field. The Actor will override the state selection and return county statistics. |
| What is the difference between traditional and categorical statistics? | Traditional statistics report each drought level as cumulative coverage, so D0 includes D1 through D4. Categorical statistics report each level as its own non-overlapping slice, so the percentages add up to 100%. |
| How far back can I get data? | The US Drought Monitor has published weekly maps since January 2000. You can set the start date to any week from then onward. |
| Can I get data for Puerto Rico? | Yes, Puerto Rico is included in the Area of interest dropdown as a separate option. |
| What date format should I use? | The Actor accepts dates like '1/1/2024' or '2024-01-01'. The US Drought Monitor publishes one map per week, so each week inside your range becomes one record. |
| Is there a limit on how many records I can get? | You can set the Maximum records field to any number from 1 to 1,000,000. The Actor stops after collecting that many rows. |
| Do I need an API key? | No. The Actor reads the public statistics tables from the US Drought Monitor website directly, so no registration or key is required. |
| Can I export the data? | Yes, the Actor returns data in a structured format that you can export to CSV, JSON, Excel, or XML from the Apify platform. |
Related actors
Browse the full ParseForge collection for more scrapers.
🆘 Need help? Email parseforge@protonmail.com with your run ID, your input, and what you expected.
⚠️ Disclaimer. This Actor is unofficial and is not affiliated with, endorsed by, or sponsored by National Drought Mitigation Center. It collects only publicly available data. You are responsible for using the collected data in compliance with the source's terms of service and applicable data-protection laws, including GDPR, CCPA, and PIPL. Do not use it to collect personal data unlawfully.


