Google Maps Traffic Scraper
Pricing
from $1.00 / 1,000 tile fetcheds
Google Maps Traffic Scraper
Fetch real-time and historical traffic data from Google Maps as GeoJSON. Returns road-level speed levels, congestion status, and road segments for any coordinate and zoom level.
Pricing
from $1.00 / 1,000 tile fetcheds
Rating
0.0
(0)
Developer
Romy
Maintained by CommunityActor stats
2
Bookmarked
33
Total users
4
Monthly active users
21 days ago
Last modified
Categories
Share
Google Traffic Scraper
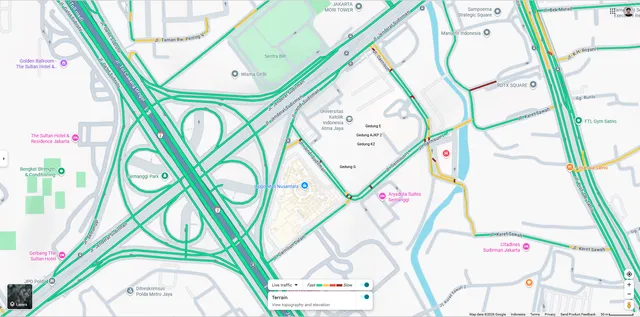
Fetch real-time traffic data from Google Maps as GeoJSON — road-level speed levels, congestion status, and road segments for any coordinate and zoom level.
Powered by Google Maps internal tile API. Data is returned as a GeoJSON FeatureCollection with LineString geometries, ready to plug into Mapbox, Leaflet, QGIS, or any GIS tool.
Input
| Field | Type | Required | Description |
|---|---|---|---|
lat | string | ✅ | Latitude of the center point |
lon | string | ✅ | Longitude of the center point |
zoom | int | ✅ | Map zoom level (10–20). Higher = more detail |
radius | int | ✅ | Tile radius around center. Total tiles = (2r+1)² |
seconds | int | ❌ | Seconds into week (see below). -1 = current time |
zoom — choosing the right level
| Zoom | Coverage per tile | Best for |
|---|---|---|
| 10–12 | City-wide | Heatmap, macro overview |
| 13–15 | District / kawasan | Area analysis |
| 16–17 | Street level | Per-road congestion ✅ recommended |
| 18–20 | Lane level | High-detail, niche use cases |
Recommended:
zoom: 17for street-level detail with reasonable tile count.
radius — area coverage
Radius controls how many tiles are fetched around the center point.
| Radius | Tiles fetched | Approx. area (zoom 17) |
|---|---|---|
| 0 | 1 | ~300m × 300m |
| 1 | 9 | ~900m × 900m |
| 2 | 25 | ~1.5km × 1.5km ✅ recommended |
| 3 | 49 | ~2.2km × 2.2km |
| 5 | 121 | ~3.7km × 3.7km |
Higher radius = more HTTP requests = higher cost and longer run time.
seconds — historical traffic
Pass -1 to get current live traffic.
To fetch traffic for a specific time in the week, convert a datetime to seconds-into-week (Sunday 00:00 UTC = 0):
Note: Google Maps traffic data is based on historical weekly patterns. The
secondsvalue represents a point in the weekly cycle, not an absolute timestamp — so the same value will return the same traffic pattern every week.
Output
Returns a GeoJSON FeatureCollection:
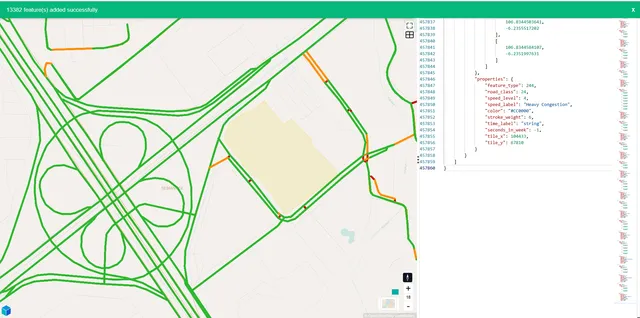
Speed levels
speed_level | Label | Color |
|---|---|---|
| 1 | Free Flow | #2DB82D 🟢 |
| 2 | Slow Traffic | #FF8C00 🟠 |
| 3 | Moderate Congestion | #FF4500 🔴 |
| 4 | Heavy Congestion | #CC0000 🔴 |
| 6 | Road Closed | #000000 ⚫ |
Pricing
This Actor uses Pay Per Event billing — you only pay for what you use.
| Event | Price | Description |
|---|---|---|
apify-actor-start | $0.00005 | Per run start |
tile-fetched | $0.001 | Per tile fetched from Google |
Cost is fully predictable before you run — it depends only on the radius you choose:
| Radius | Tiles | Cost per request |
|---|---|---|
| 0 | 1 | ~$0.001 |
| 1 | 9 | ~$0.009 |
| 2 | 25 | ~$0.025 ✅ |
| 3 | 49 | ~$0.049 |
| 5 | 121 | ~$0.121 |
No surprise charges — tile count is always
(2 × radius + 1)², known upfront.
Use cases
- Logistics & delivery — route optimization based on real congestion data
- Urban planning — traffic pattern analysis by time of day / day of week
- Real estate — congestion scoring for property valuation
- Retail analytics — foot traffic and accessibility scoring near stores
- Insurance — road risk scoring by location and time
Notes
- Data reflects Google Maps traffic patterns and is updated periodically by Google.
- Historical data (
secondsparameter) is based on weekly recurring patterns, not archived snapshots. - Higher zoom levels and larger radius values increase both cost and run time proportionally.