Finnhub Stock Market Data
Pricing
from $2.00 / 1,000 data fetcheds
Finnhub Stock Market Data
Pull real-time stock quotes, historical OHLCV candles, company profiles, financial metrics, earnings calendars, company news, and symbol lookups for any publicly traded stock, cryptocurrency, or forex pair -- all powered by the [Finnhub](https://finnhub.io/) financial data API.
Pricing
from $2.00 / 1,000 data fetcheds
Rating
0.0
(0)
Developer
Ryan Clinton
Maintained by CommunityActor stats
1
Bookmarked
25
Total users
3
Monthly active users
21 days ago
Last modified
Categories
Share
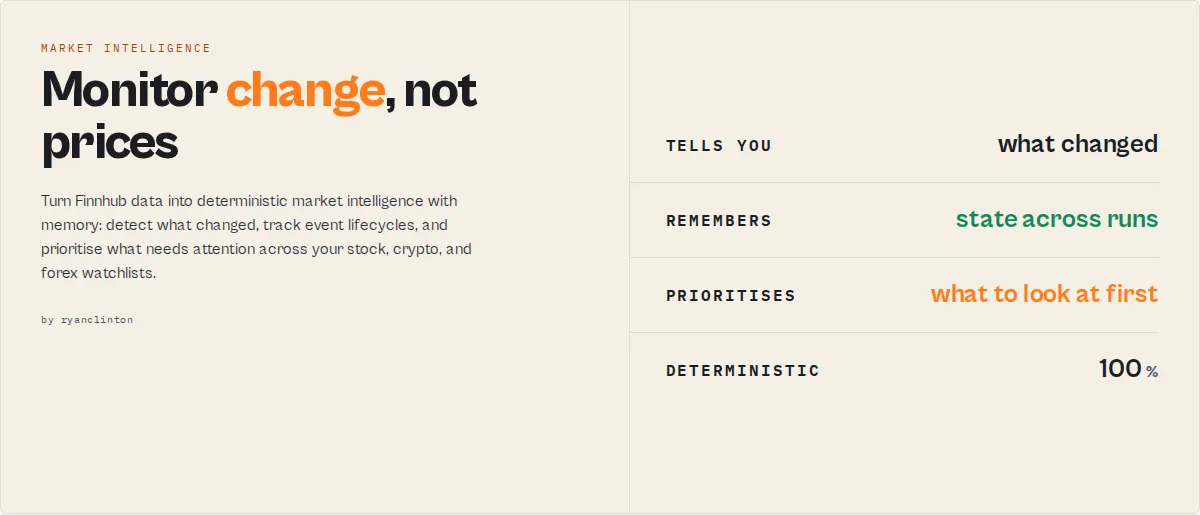
Stop monitoring prices. Start monitoring change.
Market intelligence with memory, for stocks, crypto, and forex. Stop pulling raw market data and building your own alert logic. This actor turns Finnhub data into deterministic market intelligence that answers the three questions a professional workflow actually asks:
- What changed since last time?
- What needs attention first?
- Which trends are persistent versus noise?
Most financial APIs tell you what happened. This actor tells you what changed, what still matters, and what to look at first — and remembers it across runs.
Designed for scheduled monitoring, not one-off lookups.
Descriptive, not advisory. This actor classifies, monitors, and contextualises market data. It does not emit buy / sell / hold signals, price targets, or any quality/health/investment score, and it is not investment advice. See What this does not do.
Most APIs return this
This actor returns this
Why this exists
Most financial APIs answer one question: what is the price? Professional workflows need answers to different questions, the ones you currently write custom scripts and stitch alerts together to get:
- What changed since yesterday?
- Which symbols need attention?
- Which events are still active, and how long have they run?
- Which watchlists are improving and which are deteriorating?
- Is this classification persistent, or this-run noise?
This actor was built to answer those questions deterministically. No LLMs. No prompts. No subjective scoring. No buy/sell recommendations. Just stable market intelligence that automation platforms can trust.
Who this is for
- Portfolio monitoring — track 20 to 500 symbols and receive only what changed, not 500 rows of raw data.
- Automation builders — route Dify, Make, Zapier, and n8n workflows on deterministic enums (
attentionLevel,transitions,eventSeverity) instead of LLM prompts. - Research teams — build historical datasets of state transitions, event persistence, and watchlist drift for backtesting.
- Newsletter & content pipelines — generate a daily "what changed" digest without manually reviewing dozens of tickers.
Three ways to use it
Ten modes exist, but the product is really three:
| Mode | In three words | Answers | Returns |
|---|---|---|---|
Snapshot (snapshot) | Understand the present | What does this look like right now? | One composite record per symbol: price + valuation + volatility + news tone + 52-week position + a marketState. |
Monitor (monitor) | Detect change | What changed since last time? | State transitions, event lifecycle, attention, drift, and accumulated per-symbol memory, diffed against the last run. |
Command Center (command-center) | Prioritise attention | What do I look at first? | One digest: needsAttention (symbols ranked), topChanges, criticalEvents, watchlist regime + health. |
The remaining modes (quote, candles, profile, news, search, earnings, metrics, compare-watchlists) are the building blocks and a cross-watchlist comparison. Everything else is implementation detail.
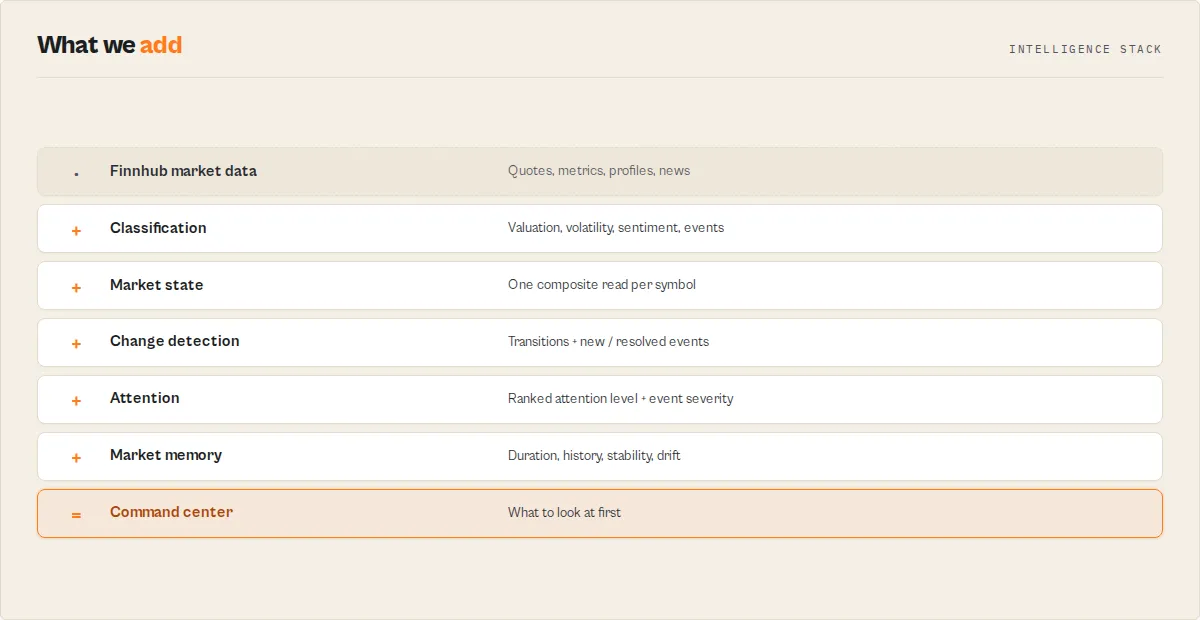
The pipeline that produces it:
Try this in 5 minutes
Run this once:
Then run the exact same input again tomorrow. Instead of getting the same data twice, the second run returns the things a plain data API never could:
- state
transitions(what flipped since yesterday) newEvents/resolvedEventswatchlistDrift+watchlistHealth- accumulated
stateDuration,stability, andstateVelocity
That is the difference between a market-data API and a monitoring system.
Market memory
Most actors forget everything between runs. This actor remembers. Name a watchlist, run it on a schedule, and it accumulates state across runs:
- State duration — how long the current trend / valuation / volatility has held (
stateDuration), and a persistence confidence from it (stateConfidence). - Event history — how long each event has stayed active and how many times it has fired (
activeEvents,eventHistory.timesTriggered). - Transition frequency — how often each classification flips (
stability: stable / settling / volatile). - Long-term trajectory — whether sentiment and trend are improving or deteriorating over the stored window (
history,stateVelocity). - Watchlist drift — how the whole watchlist is moving (
watchlistDrift,watchlistHealth).
Unlike most financial APIs, this actor becomes more valuable over time. Every run adds historical state, event history, drift analysis, and persistence tracking to your watchlists.
A competitor can reproduce the math in a weekend; they cannot reproduce months of accumulated watchlist state, event lifecycles, and drift history without rebuilding their architecture around persistent monitoring from day one. This is the moat: market memory, not just market data.
What happens after 30 days?
Most APIs only ever know today's market state. After a month of scheduled runs, this actor also knows:
- how long a trend has persisted
- how often a classification changes
- whether sentiment is improving or deteriorating
- which events repeatedly occur
- which watchlists are drifting
That knowledge exists only because the actor remembers. It is not in any single Finnhub response; it is built one run at a time.
Why not just use Finnhub?
Finnhub tells you:
This actor tells you:
Finnhub provides market data. This actor provides market intelligence: what changed, what still matters, and what to look at first. If you only need the price, use Finnhub directly. If you need to know what changed since yesterday across a watchlist, that is what this actor is for.
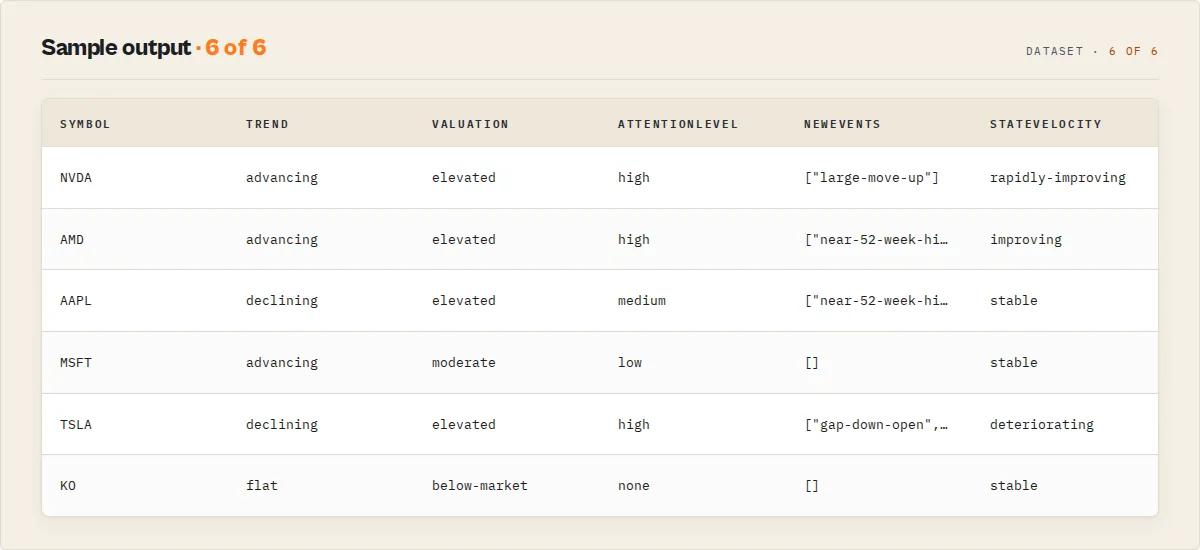
A real monitoring run
Yesterday's run stored NVDA as quiet:
Today's run diffs against it and surfaces only the change:
A normal API gives you today's price. This actor tells you what changed, how fast, and that the uptrend has now held for 14 runs.
Compared to raw financial APIs
| Capability | Finnhub | Alpha Vantage | This actor |
|---|---|---|---|
| Quotes / metrics / news | ✓ | ✓ | ✓ |
| Remembers previous runs | ✗ | ✗ | ✓ |
| Explains what changed | ✗ | ✗ | ✓ |
| Prioritises your attention | ✗ | ✗ | ✓ |
| Deterministic classification | ✗ | ✗ | ✓ |
| Event detection + severity | ✗ | ✗ | ✓ |
| Watchlist monitoring | ✗ | ✗ | ✓ |
| State transitions + lifecycle | ✗ | ✗ | ✓ |
| Historical state memory | ✗ | ✗ | ✓ |
| Command-center digest | ✗ | ✗ | ✓ |
| Cross-watchlist comparison | ✗ | ✗ | ✓ |
| Automation-ready enums | ✗ | ✗ | ✓ |
Your real alternatives are not other data APIs; they are TradingView alerts, Finviz screeners, Koyfin watchlists, and the custom monitoring scripts you would otherwise maintain yourself.
Compared to TradingView alerts
| Capability | TradingView alerts | This actor |
|---|---|---|
| Detects events | ✓ | ✓ |
| Remembers previous runs | ✗ | ✓ |
| Tracks event lifecycles | ✗ | ✓ |
| Watchlist drift | ✗ | ✓ |
| Portfolio intelligence (compare watchlists) | ✗ | ✓ |
| Historical state memory | ✗ | ✓ |
| Structured JSON for automation | ✗ | ✓ |
TradingView fires an alert and forgets it. This actor records it, ages it, and tells you whether it is still active and how the whole watchlist is drifting around it.
Use cases
- Daily watchlist monitoring — schedule
monitor(orcommand-center) every morning and receive state transitions, new/resolved events, and watchlist drift instead of raw quotes. - Portfolio oversight — track trend persistence, volatility changes, sentiment deterioration, and active events across hundreds of symbols in one run.
- Dify / Make / Zapier automation — trigger workflows when
valuationchanges, an event appears, sentiment deteriorates, orattentionLevelbecomes critical. No LLM classification required. - Research pipelines — build historical datasets of market states, event lifecycles, transition frequency, and state velocity for backtesting and analysis.
Key features
- Ten data modes in one actor -- quotes, candles, profiles, news, symbol search, earnings, metrics, a composite
snapshot, a statefulmonitor, and acommand-centermode that returns one digest answering "what do I look at first?". - Cross-run change detection + memory (
monitormode) -- name a watchlist, run it on a schedule, and get state transitions, event lifecycle (with age + times-triggered), anattentionLevel, watchlist drift, and accumulated per-symbol memory (symbolContext,stability, long-runhistory,stateVelocity). The accumulated state is what a stateless wrapper structurally cannot reproduce. - Command-center digest (
command-centermode) -- one record per run:needsAttention(symbols ranked),topChanges,criticalEvents, watchlist drift + regime. The anti-data-blindness surface: read three symbols, not two hundred rows. - Deterministic intelligence on every record -- market-cap tiering, valuation context, 52-week range position, beta-based volatility class, dividend profile, news sentiment + headline-type classification, earnings beat/miss, deterministic
events[]flags + a top-leveleventSeverity+ structuredtriggers[], opt-in peer/sector benchmarking, and an opt-in symbol screener. - Technical indicators -- in candles mode, SMA50/SMA200, RSI14, ATR14, and a trend-regime classification computed from the OHLCV bars (requires Finnhub candle access).
- Plain-English
summaryon every row -- a one-line, LLM-quotable description an agent or a spreadsheet can read without joining fields. - Run summary record + KV mirror -- every run emits a
recordType: "summary"digest (counts, distributions, top mover) and pins it to theSUMMARYkey-value store record for one-object dashboard reads. - Streamed output -- each symbol's rows appear in the dataset the moment they resolve, so results start showing within about a minute instead of after the whole run.
- Multi-symbol batch processing -- pass an entire watchlist in one run; results stream into a single dataset with a
recordTypediscriminator per record. - Output profiles -- choose
minimal(summary + headline classification only),standard(data + intelligence), orfull(everything, including the completeness confidence object). - Resilient by design -- per-symbol error isolation (one failed ticker never wipes the batch), automatic retry with backoff on rate limits and transient errors, a circuit breaker that fails fast on a bad key, and a typed
failureTypeon every error record. - Crypto and forex support -- query pairs using exchange-prefixed symbols like
BINANCE:BTCUSDTalongside traditional stock tickers.
How to use Finnhub Stock Market Data
- Get a free Finnhub API key. Visit finnhub.io/register, create an account, and copy the API key from your dashboard. The free tier allows 60 API calls per minute.
- Open the actor in Apify Console. Go to Finnhub Stock Market Data and click "Start".
- Paste your API key. Enter it into the "Finnhub API Key" field. The field is encrypted and sent to Finnhub as a request header, never exposed in logs or output URLs.
- Select a data mode. Choose one of the seven modes.
- Enter your stock symbols. Add one or more tickers (e.g.
AAPL,MSFT,TSLA). For crypto, use the exchange-prefixed format likeBINANCE:BTCUSDT. For Symbol Search mode, enter a search query instead. - Adjust optional settings. Set the candle resolution, the look-back window (
daysBack, 1 to 365), and the output profile. - Run and export. Click Start, watch rows stream in, then download as JSON, CSV, or Excel, or connect the output to Zapier, Make, Dify, Google Sheets, or the Apify API.
Input parameters
| Field | Type | Required | Default | Description |
|---|---|---|---|---|
apiKey | string (secret) | Yes | -- | Your API key from finnhub.io. Without it, the actor logs a setup message and exits cleanly (no data, no charge). |
mode | string (select) | No | quote | quote, candles, profile, news, search, earnings, metrics, snapshot, monitor, command-center, or compare-watchlists. |
symbols | string[] | Conditional | ["AAPL","MSFT","GOOGL"] | Ticker symbols to query. Required for all modes except search. Up to 200 per run. |
watchlistName | string | No | default | Monitor / command-center modes. Names the cross-run state store; each name is an independent watchlist that diffs against its own prior run. |
watchlists | string[] | Conditional | -- | Required for compare-watchlists. Two or more previously-run watchlist names to rank by health. No Finnhub calls, no key needed. |
searchQuery | string | Conditional | -- | Company name or keyword for symbol lookup. Required only in search mode. |
resolution | string (select) | No | D (Daily) | Candle resolution: 1, 5, 15, 30, 60 (minutes), D, W, M. |
daysBack | integer | No | 30 | Days of history for candles, news, and earnings. Range 1 to 365. |
outputProfile | string (select) | No | standard | minimal (summary + headline only), standard (data + intelligence), or full (everything incl. confidence). |
enablePeerComparison | boolean | No | false | Benchmark each symbol against its Finnhub peers (metrics / snapshot modes). Adds ~7 calls per symbol. |
screen | object | No | -- | Tag your symbols against criteria (metrics / snapshot): marketCapTier, peMax, peMin, betaMax, dividendMin. |
Input example
Tips for best results
- Start with quote mode to verify your API key works before moving to other modes.
- Batch your symbols into a single run rather than running once per ticker. Rows stream into one clean dataset with a
recordTypeper record. - Read the
summaryfield first. Every record carries a one-line plain-English summary you can drop straight into a Slack message, a sheet cell, or an LLM prompt. - Use
outputProfile: "minimal"when feeding an agent or a dashboard that only needs the verdict, not the raw fields. - For crypto symbols, use the exchange-prefixed format like
BINANCE:BTCUSDT.
The intelligence layer
Every classification is deterministic and documented. None of it requires an extra API call; it is computed from the data the mode already returns.
| Mode | Raw data | Added intelligence |
|---|---|---|
monitor | quote + metrics + news per symbol, vs prior run + accumulated history | one recordType:"monitor" record per symbol with current state, transitions, event lifecycle (activeEvents, eventHistory), attentionLevel, plus accumulated memory: symbolContext, stability, long-run history, stateVelocity. Three calls per symbol. |
command-center | same as monitor, one digest | one recordType:"command-center" record for the whole watchlist: needsAttention (ranked), topChanges, criticalEvents, drift + regime + health. Per-symbol records suppressed; charged once. |
compare-watchlists | stored state only (no fetch, no key) | one recordType:"watchlist-comparison" record ranking previously-run watchlists by health: strongest, improving[], deteriorating[]. |
snapshot | quote + profile + metrics + recent news, fused | one recordType:"snapshot" record per symbol with a composite marketState (trend / valuation / volatility / news tone / 52-week position) plus events[], triggers[], marketNarrative, newsMomentum, and signalAlignment. The run summary adds watchlist analytics: watchlistType archetype, watchlistTheme (e.g. semiconductors-strength), breadth, dispersion, leadership, and watchlistOutliers. Makes four Finnhub calls per symbol. |
quote | price, change, day high/low, prev close | intraday (direction, move magnitude, day-range position, gap), events[] (gap-up/down, large-move, near-day-high/low) |
profile | name, market cap, industry, IPO date | marketCapTier (mega/large/mid/small/micro/nano), companyAgeYears since IPO |
metrics | P/E, P/B, P/S, beta, 52w high/low, yield | valuation (flags + market-median note), pricePosition52w + band, volatilityClass, dividend, events[] (near-52-week-high/low). Two calls/symbol (/stock/metric + /quote). Opt-in peerContext and screen. |
news | headline, summary, source, URL | sentiment + sentimentScore (deterministic lexicon) and headlineType (earnings / guidance / analyst-action / partnership / lawsuit / regulatory / acquisition / product-launch / management / dividend / other) |
earnings | EPS actual vs estimate | surprise (beat/miss/inline + magnitude), epsBeat / revenueBeat booleans, events[] (earnings-beat/miss, large-eps-surprise) |
candles | OHLCV bars | per-symbol technicals (SMA20/50/200, RSI14, ATR14, trend state, momentum state, trend classification, multi-timeframe short/medium/long-term alignment) + series stats + candle events[], in the run summary. Requires candle access (Finnhub premium). |
Every data record also carries recordType, schemaVersion, a one-line summary, and (in full profile) a confidence object describing how complete the underlying data was.
Opt-in add-ons (metrics + snapshot):
enablePeerComparison: truebenchmarks each symbol against its Finnhub peer group (which is its sector cohort), returningpeerContext:marketCapRank,peRank,valuationRelative(premium/inline/discount vs the peer-median P/E),volatilityRelative(above/below-average vs the peer-median beta),sizeRelative,peerMedianPe,peerMedianBeta. Adds up to ~7 extra calls per symbol.screen: { marketCapTier, peMax, peMin, betaMax, dividendMin }tags each of your symbols withscreen.match+screen.reasons[]. This screens the symbols you supply; it does not discover new symbols from a universe. Non-matches stay in the output withmatch: false.
Monitor mode (cross-run change detection)
mode: "monitor" turns the actor into a scheduled watchlist monitor. It computes each symbol's descriptive state (trend / valuation / volatility / news tone / 52-week position), stores it in a named state store keyed by watchlistName, and on the next run diffs against the last run to tell you what changed.
Each monitor record carries:
state— the current descriptive state.transitions—[{ field, from, to }]for each state dimension that changed since the last run (e.g.valuation: normal → elevated).newEvents/resolvedEvents— event flags that appeared or cleared since the last run.changes[]— high-level change tags (valuation-state-changed,event-added, …).attentionLevel— an operational priority (none / low / medium / high / critical) that escalates by how much the state moved, plusattentionReasons[]. This is a "look at this because it changed" signal, not a quality score.attentionAge/attentionFreshness— how many runs the attention level has been held, and a fresh / aging / stale tag, so a symbol stuck at "high" for five runs stops nagging.activeEvents/eventHistory— event lifecycle:[{ event, ageDays, lifecycle, timesTriggered }]plus a cumulativeeventHistorymap (firstSeen,timesTriggered,maxSeverity). Tells you the 52-week-high is 8 days old and has fired 7 times, not just that it fired.newsMomentum— improving / deteriorating / stable, from the recent vs prior half of the news window.
It also accumulates memory across runs:
symbolContext— runs spent in each notable state:{ runsTracked, runsAdvancing, runsElevatedValuation, runsPositiveNews, runsHighVolatility, totalStateTransitions, totalEventTriggers }. "Elevated valuation for 18 of 22 runs" is something a stateless wrapper can't tell you.stateDuration/stateConfidence— how many runs the current trend / valuation / volatility / news-tone value has held, and atentative/moderate/strongconfidence in the classification derived from that persistence. "Elevated" is a level; "elevated for 71 runs (strong)" is a fact only memory can give you.stability— how often each classification has flipped, plus astable/settling/volatilelabel per dimension, so you know whethervaluation: elevatedis persistent or this-run noise.history— long-run trajectory from a bounded rolling window:{ trend, sentiment (improving/deteriorating/stable), volatility (rising/falling/stable) }. Builds once enough runs are stored.stateVelocity—rapidly-improving/improving/stable/deteriorating/rapidly-deteriorating, combining this run's churn with the trajectory. A level tells you where it is; velocity tells you how fast it's moving.
Command-center mode
mode: "command-center" runs the same per-symbol computation and state persistence as monitor, but emits one recordType: "command-center" digest instead of per-symbol records (and charges once). It answers "what do I look at first?": needsAttention (symbols ranked by attention level), topChanges, criticalEvents, marketNarrative, plus the watchlist regime, watchlistDrift, watchlistHealth, breadth, dispersion, and leadership. The anti-data-blindness surface for a 50-symbol watchlist.
Portfolio intelligence (compare watchlists)
mode: "compare-watchlists" with watchlists: ["growth-tech", "dividend", "crypto"] compares multiple watchlists and identifies the strongest, the improving, and the deteriorating — built entirely from accumulated watchlist history, with no market-data calls and no API key required. Each named watchlist must have been run in monitor or command-center mode first; any that hasn't is reported honestly as no-data. This is the portfolio-level view that only an actor with persistent memory can produce.
The run summary rolls these up into watchlistChanges (how many symbols changed, total new/resolved events), a majority-vote watchlistState with a descriptive regime (risk-on / risk-off / neutral), watchlistDrift (the watchlist's aggregate state vs its own prior run: { direction, magnitude, transitions }), cohort analytics (breadth, dispersion, leadership), and watchlistOutliers (the most-extreme symbol per dimension).
First run is a baseline: with no prior state, every symbol is isFirstRun: true with empty transitions, and the summary reads "baseline captured". Transitions and resolved events appear from the second run onward. Schedule the same watchlistName (hourly, daily) and each run reports only the deltas. State is bounded (up to 1000 symbols per watchlist) and persists across migrations and aborts.
Output
Output example
Quote mode (mode: "quote", outputProfile: "standard"):
Snapshot mode (mode: "snapshot", enablePeerComparison: true) — the composite cross-signal record:
Metrics mode (mode: "metrics"):
Summary record (emitted once per run, also mirrored to the SUMMARY key-value store record):
Record types
recordType | When | Contents |
|---|---|---|
quote / candle / profile / news / search / earnings / metrics | per data row | the fetched data plus its mode-specific intelligence |
snapshot | per symbol (snapshot mode) | composite record: price + profile + valuation + newsTone + marketState + events[] + triggers[] + signalAlignment (+ optional peerContext / screen) |
monitor | per symbol (monitor mode) | current state + transitions + event lifecycle + attentionLevel + symbolContext + stability + stateDuration + stateConfidence + history + stateVelocity |
command-center | one per run (command-center mode) | needsAttention + topChanges + criticalEvents + watchlist drift / regime / watchlistHealth |
watchlist-comparison | one per run (compare-watchlists mode) | strongest + improving[] + deteriorating[] + per-watchlist health |
summary | once per run | counts, distributions, and the headline digest; mirrored to the SUMMARY KV record |
error | on failure | failureType (auth / rate_limit / blocked / no-data / timeout / upstream-error / invalid-input), a suggestedAction (check-api-key / upgrade-finnhub-plan / reduce-symbol-count / …), a human-readable message, and (for partial runs) a symbolErrors list |
Use in Dify
This actor returns classified, enum-bearing JSON, which is exactly the shape Dify if/else nodes branch on. A competitor pointed at the same Finnhub endpoint returns raw numbers your workflow has to interpret; this returns sentiment, surprise.result, marketCapTier, volatilityClass, pricePosition52wBand, and a recordType discriminator your node can route on directly.
Actor ID: tsl8SzioHu42ZEK6m
Sample input for a news-sentiment watch:
In a Dify workflow, an if/else node routes on the stable enums without parsing any prose:
sentiment == "negative"-> branch to a Slack alert node ("negative coverage detected for {{symbol}}")sentiment == "positive"-> branch to a digest node- else -> ignore
The same pattern works on other modes: route on surprise.result == "beat" (earnings), pricePosition52wBand == "near-high" (metrics), intraday.moveMagnitude == "large" (quotes), eventSeverity == "high" or attentionLevel == "critical" (any mode) to alert only on what matters, recordType == "monitor" + a non-empty transitions array to fire only when a watchlist symbol changed state, or recordType == "error" with failureType == "blocked" to fall back to a different source. Because every classification is deterministic, the same input always routes the same way, no flaky LLM calls in your branch logic. The one-line summary field is usable verbatim as the human-readable body of any notification, no LLM rewriting required.
API & Integration
You can call this actor programmatically using the Apify API. The actor ID is tsl8SzioHu42ZEK6m.
Python
JavaScript
Integrations
- Zapier -- trigger the actor and push stock data to Google Sheets, Slack, Airtable, or 5,000+ other apps using the Apify Zapier integration.
- Make (Integromat) -- build workflows that branch on
sentiment,surprise.result, orpricePosition52wBandand route alerts. - Dify -- see Use in Dify above.
- Google Sheets -- export results directly for charting, pivot tables, or watchlist dashboards.
- Webhooks -- configure Apify webhooks to notify your own endpoint when a run completes.
How it works
- The actor reads your input and validates the selected mode.
- It routes requests to the appropriate Finnhub API v1 endpoint, sending your key as a request header.
- For symbol-based modes it iterates each ticker, retrying with backoff on rate limits and transient errors, and isolating per-symbol failures so one bad ticker never wipes the batch.
- Each response is normalised (Unix timestamps to ISO 8601, standardised field names) and passed through the deterministic classification layer.
- Each symbol's rows stream into the dataset as they resolve. A run summary record and
SUMMARYKV mirror are written at the end.
Performance & cost
This actor is billed pay-per-event at $0.002 per output record retrieved (the run summary record is not charged). The Finnhub free tier allows 60 API calls per minute, which comfortably supports batch queries of up to ~50 symbols per run; the actor retries with backoff if you approach the limit. Most runs use 256 MB of memory and finish in under 30 seconds.
| Scenario | Symbols | Records | Approx. PPE |
|---|---|---|---|
| Daily quote check | 5 | 5 | $0.010 |
| Weekly metrics snapshot | 20 | 20 | $0.040 |
| News scan (3 days) | 10 | ~80 | ~$0.160 |
PPE charges are for output records only and exclude Apify platform compute. The actor never charges for empty or failed results.
What this does not do
- No buy / sell / hold signals and no price targets. The classification layer is descriptive (it tells you a stock trades above the market-median P/E, or that news coverage skews negative); it does not tell you what to do about it. This is a deliberate design choice, not a missing feature.
- No composite "health score" or stock-quality rating. A single 0-100 score blending valuation, profitability, and stability reads as a buy signal no matter how it is labelled, so the actor deliberately does not emit one. It gives you the per-dimension descriptive classifications (each a fact) and stops there.
- The screener tags your symbols; it does not discover them.
screenflags which of the symbols you supplied match your criteria. Finnhub's free tier has no "list every large-cap with P/E under 25" universe endpoint, so the actor does not pretend to scan the whole market. - Not investment advice. Data is provided as-is from Finnhub. Verify critical data points against primary sources before any financial decision.
- Not a real-time tick feed. This actor makes point-in-time API calls; it does not hold a websocket connection. For continuous streaming, use Finnhub's websocket API directly.
- Not a substitute for a paid Finnhub plan's coverage. Some endpoints (notably intraday and historical stock candles) and some fundamentals are restricted on Finnhub's free tier and return a
403; the actor reports this clearly on the error record rather than failing silently. Modes that work on free keys (quotes, profiles, metrics, news, search) return real data.
FAQ
Do I need a paid Finnhub plan?
The free Finnhub key covers quotes, company profiles, financial metrics, company news, and symbol search. Some endpoints, notably historical stock candles, were moved to Finnhub's premium tiers and return a 403 on free keys; when that happens the actor reports it on the error record with a clear message. Sign up at finnhub.io/register.
What happens if I run without an API key? The actor logs a setup message pointing you to finnhub.io/register and exits cleanly. No API calls, no errors, no charge.
What is the summary field?
A one-line, plain-English description of each record, built deterministically from the data. It is safe to paste into a Slack message, a sheet, or an LLM prompt without joining other fields.
Is the classification investment advice? No. Every classification is descriptive and deterministic (for example, "trades above the market-median P/E" or "news sentiment negative"). The actor emits no buy/sell/hold signal. See What this does not do.
Can I track crypto and stocks in the same run?
Yes. Mix regular tickers (AAPL) with exchange-prefixed crypto symbols (BINANCE:BTCUSDT) in the same list.
Why do some metrics or profile fields show null?
Finnhub may not have a given metric for every company, particularly smaller-cap, international, or recently listed stocks. The actor sets the field to null and lowers the record's completeness confidence rather than inventing a value.
Related actors
| Actor | Description |
|---|---|
| CoinGecko Crypto Data | Cryptocurrency prices, market cap, volume, and historical data covering 10,000+ coins. |
| SEC EDGAR Filing Analyzer | Search and analyse SEC filings including 10-K, 10-Q, and 8-K reports. |
| SEC Insider Trading | Track insider buying and selling from SEC Form 4 filings across all public companies. |
| Congressional Stock Trade Tracker | Monitor stock trades disclosed by US Congress members under the STOCK Act. |
| BLS Economic Data | US labor and price statistics with deterministic economic-signal classification. |