Etsy Keyword Research + Reverse Keyword Tool
Pricing
from $5.00 / 1,000 keyword results
Etsy Keyword Research + Reverse Keyword Tool
Find the Etsy keywords actually worth chasing. Every term is scored on real demand (live carts, recent sales), competition and buyer intent, measured from Etsy instead of estimated. Reverse-keyword a competitor's listing or a whole shop to see the searches Etsy ties to them.
Pricing
from $5.00 / 1,000 keyword results
Rating
0.0
(0)
Developer
Yakugusa Yumitori
Maintained by CommunityActor stats
1
Bookmarked
68
Total users
34
Monthly active users
15 days ago
Last modified
Categories
Share
Etsy keyword research scored on Etsy's own live data — real shopping‑cart counts, sales in the last 90 days, exact listing counts, badge saturation and price tiers. Not search‑volume guesses like eRank, Everbee or Marmalead — measured signals, straight from Etsy.
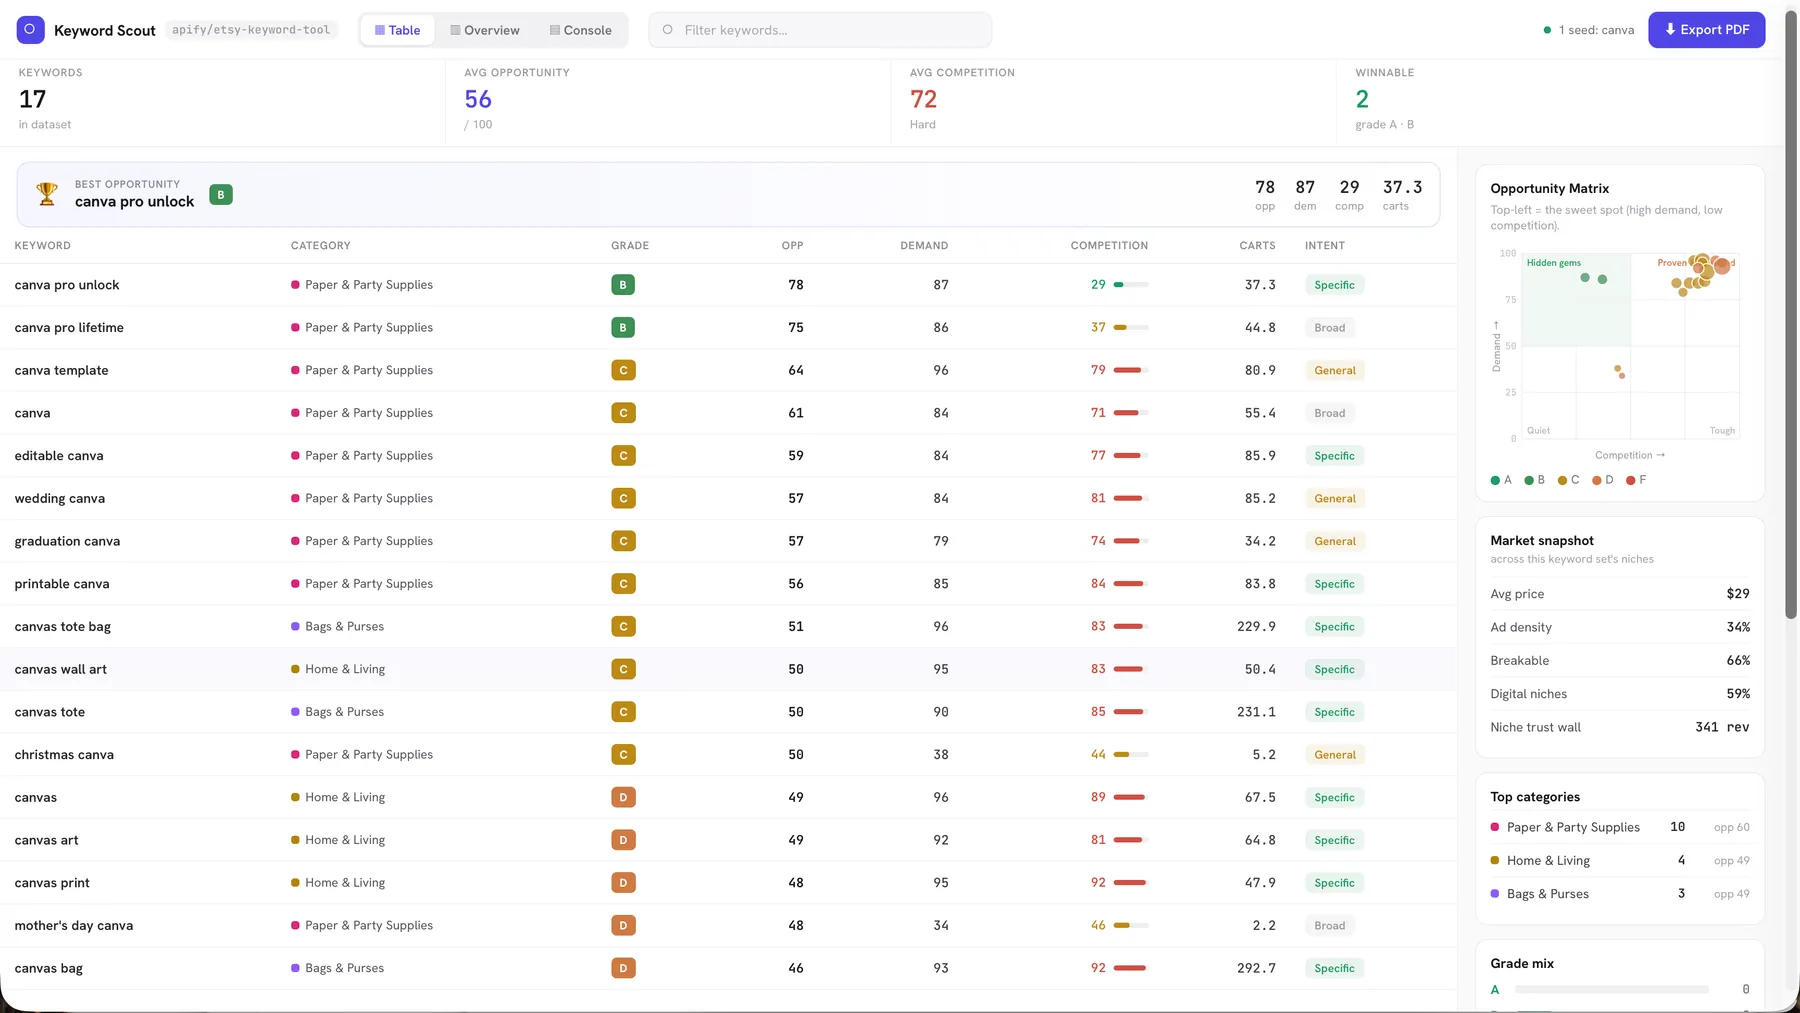
Every run builds a self‑contained visual dashboard ("Keyword Scout", above) in the Output tab — KPI cards, an Opportunity Matrix, a sortable keyword table, a market snapshot, and a click‑through detail panel. No login, no proxies, no setup.
Reading the
Intentcolumn (the coloured tags above): it's Etsy's own Query Intent Specificity for each search — 🟢 Specific = buyer‑ready (e.g. "canva pro unlock"), 🟡 General = knows the product type but not the specifics ("canva template"), ⚪ Broad = just browsing ("gift"). A Broad term can have huge demand and carts yet few real buyers — Intent tells you which high‑demand keywords are actually worth chasing.
Three ways to run
Pick one mode (you can combine the first two):
🌱 Keyword research — seeds
One seed → its whole long‑tail universe, every keyword scored 0–100 on demand / competition / margin → opportunity, with a letter grade and a plain‑English verdict. Feed several seeds to compare themes. ~1 minute.
🔄 Reverse keyword — competitor listings
Paste competitor listings and get Etsy's own "Related searches" for each — the actual queries Etsy maps to that listing — scored like any keyword. Most tools guess a rival's keywords; this reads them from Etsy's listing→search graph. Sort by opportunity to find the ones you can win.
🏪 Whole‑shop reverse — a shop name
Finds every listing in the shop and pulls Etsy's "Related searches" for each — every search Etsy associates with every listing — deduped and scored. The dashboard switches to a listing‑centric layout (one card per listing → its searches).
Whole‑shop runs by itself. When
shopNameis set, the seeds and competitor listings are ignored — it's a dedicated mode, capped bymaxShopListings(~1 request per listing). Brand‑new listings won't have "Related searches" yet, so the count can be lower than the shop's listing total — that's expected, and the run tells you how many were skipped.
Every run pulls fresh, live data — nothing is cached between runs.
📊 The dashboard ("Keyword Scout")
Saved to the run's key‑value store as dashboard.html — self‑contained, no dependencies, with an ⬇ Export PDF button. It adapts to how you ran it.
Keyword / seed runs give you three views:
- ▦ Table (above) — sortable, searchable keyword table + an insights sidebar (Opportunity Matrix, Market snapshot, top categories, grade mix) and a click‑through detail drawer.
- ▥ Overview — KPI cards, a Top‑opportunities bar chart, and category cards.
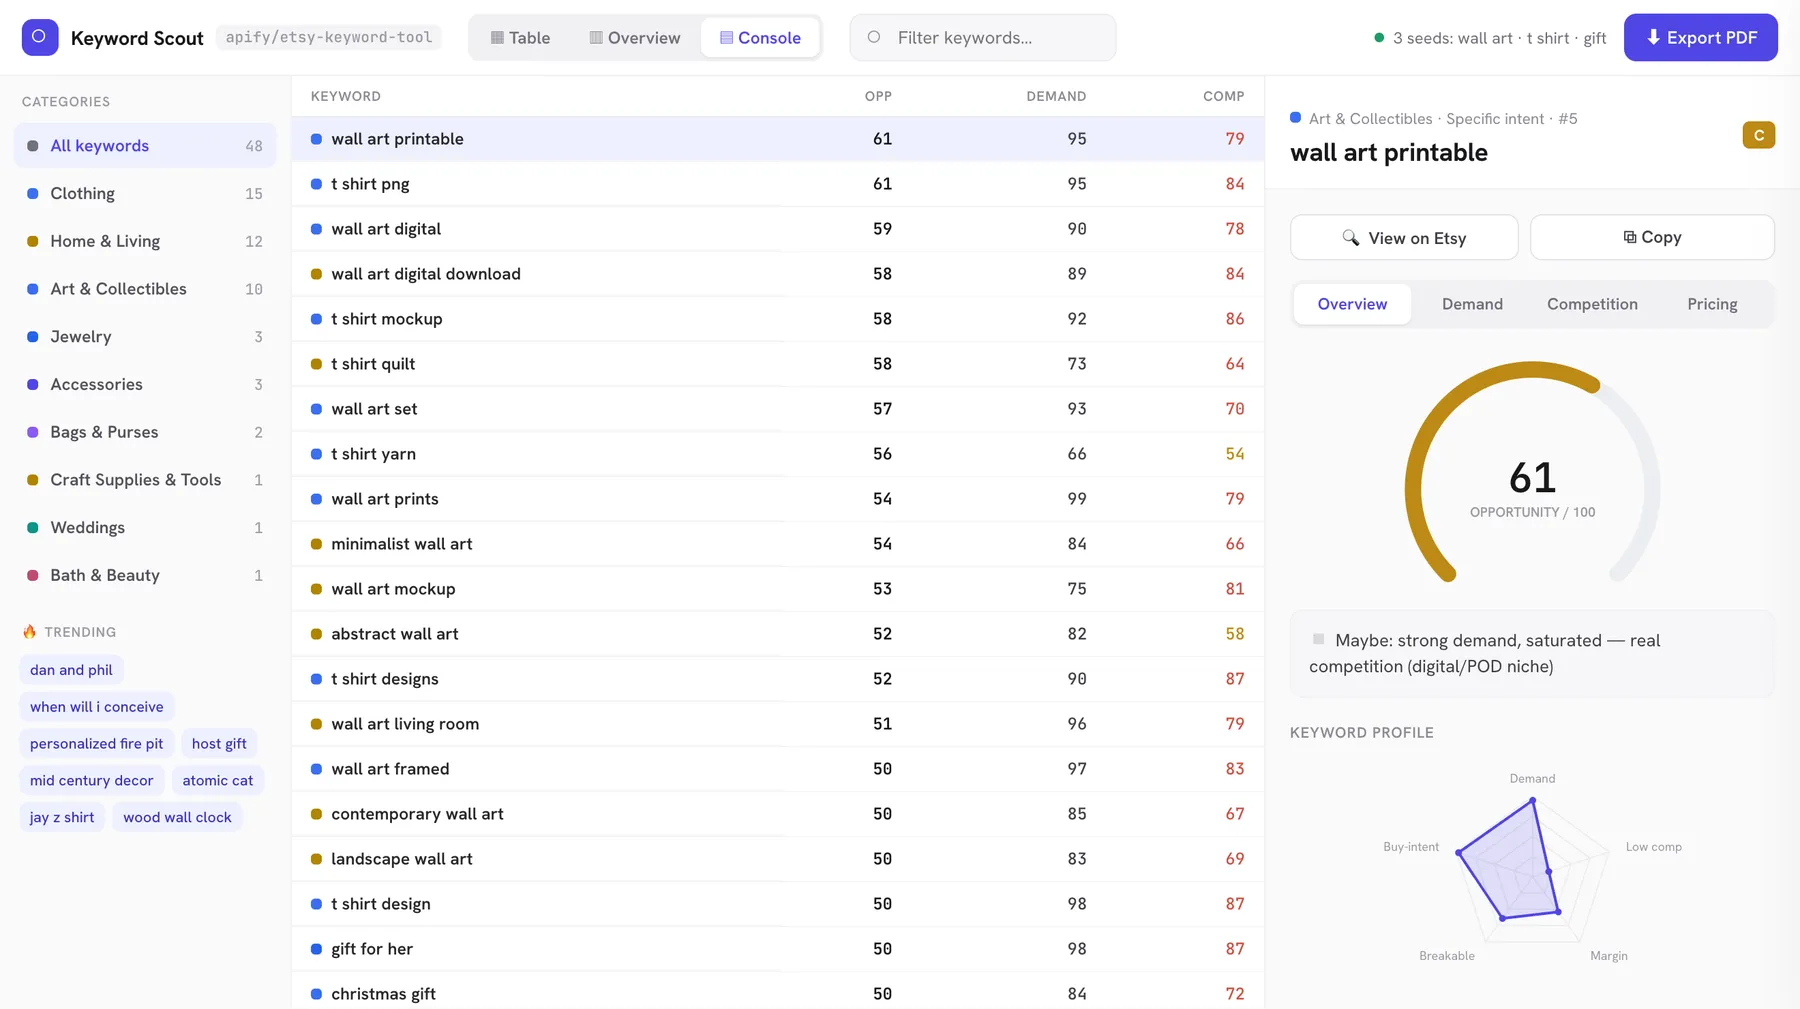
- ▤ Console — a power view: a category‑filter rail, a dense table, and a persistent detail panel.
Reverse / whole‑shop runs swap in a listing‑centric layout: 🏪 By listing (each listing → its searches), ▦ Searches (the full scored table), and ▥ Overview.
The detail panel (click any keyword) is organised into tabs — Overview / Demand / Competition / Pricing — with a radial opportunity gauge, a keyword‑profile radar, the niche's "trust wall" (typical competitor's reviews & sales), price tiers, and related keywords, plus View on Etsy and Copy buttons.
The Opportunity Matrix plots every keyword by demand (y) vs competition (x) — top‑left is the sweet spot; bubble size = live carts; colour = grade. Export PDF saves or shares a copy in one click.
What you get per keyword
Demand — avg_carts (mean live cart count across the top listings), with_carts_pct, recent_sales_pct (share of top listings sold in the last 90 days — proof it converts now), a trending flag, and intent — Etsy's own Query Intent Specificity (Broad / General / Specific) that flags whether searchers are just browsing or buyer‑ready. (A high‑cart Broad term like "gift" is a trap; "ceramic mug" is Specific.)
Competition — listings (exact count competing), bestseller_pct + starseller_pct (how entrenched the top is), and recent_listings_pct (share under a year old — if fresh listings rank, a new seller can still break in even when listings is high).
Margin — on_sale_pct (discount density — high = a price war eating margin).
Niche & price — category (where to list), category_focus_pct, digital_pct (print‑on‑demand niches), avg_price, price_tiers (the niche's common price breakpoints).
Who you're up against — ad_density_pct (how pay‑to‑play), personalize_pct, handmade_pct / vintage_pct, and the trust wall: avg_shop_rating, median_shop_reviews, avg_seller_sales. All aggregated across the top listings — niche‑level, not per‑listing.
Scores — a 0–100 Opportunity score + A–F grade, the three sub‑scores (Demand, Competition, Margin), and a plain‑English verdict.
How the score works (nothing hidden)
Every score is computed from the raw Etsy numbers on the same row:
- Demand /100 = live carts + buy‑intent (
with_carts_pct) + recent sales + Etsy's autosuggest rank + a trending bump. - Competition /100 = niche size (
listings, log‑scaled) + entrenchment (bestseller_pct+starseller_pct), eased when fresh listings still rank (recent_listings_pct). Higher = harder. - Margin /100 =
100 − on_sale_pct. - Opportunity /100 =
0.45 × Demand + 0.35 × (100 − Competition) + 0.20 × Margin.
Grades: A (80+) · B (65–79) · C (50–64) · D (35–49) · F (<35). Verdicts stay consistent with the numbers (✅ Go / ⚠️ Risky / ◽ Maybe / 🚫 Skip), with tags like selling now, breakable, price war, digital/POD, trending now.
The raw data is Etsy's own numbers (as accurate as it gets); the scores are a transparent, explainable heuristic over that data — never a black box.
Inputs
The input page is split into three sections — fill one mode:
| Field | Section | Default | What it does |
|---|---|---|---|
seeds | 🌱 Keyword research | — | 1–50 seed keywords; each expanded into its long‑tail universe |
depth | 🌱 Keyword research | 2 | expansion hops — 1 direct, 2 suggestions‑of‑suggestions, 3 explodes |
maxKeywords | 🌱 Keyword research | 40 | cap of keywords per seed (run also capped at 200 total) |
reverseListingUrls | 🔄 Reverse keyword | — | 1–25 competitor listing URLs/IDs → Etsy's "Related searches" for each, scored. Works with seeds. |
shopName | 🏪 Whole‑shop | — | one shop name/URL → reverse‑keyword every listing. Runs by itself. |
maxShopListings | 🏪 Whole‑shop | 50 | cap on listings scanned (5–200), ~1 request each |
Why a run can return fewer than
maxKeywords: it's an upper bound. A seed only expands into as many real keywords as Etsy's autosuggest has, and any keyword with no live listings is dropped — so every row is real. Bumpdepthto3or add related seeds to get more.
Use it for
- Find the gap — sort by opportunity: low listings + real carts + low bestseller density = an underserved niche.
- Break into a "saturated" niche — high
listingsbut highrecent_listings_pctmeans fresh listings still rank (the verdict flags it breakable). - Spot digital plays —
digital_pct: 100= print‑on‑demand / download niches, low fulfilment. - Avoid price wars — high
on_sale_pct= everyone discounting. - Pick category & price —
categorysays where to list;price_tiers+avg_pricesay where the niche prices. - 🔄 Steal a competitor's keywords — drop their listing into
reverseListingUrlsand chase the winnable searches instead of the saturated head terms. - 🏪 Map a rival's whole shop —
shopNamegives every search Etsy ties to every listing they have, in one run.
Turn keywords into a listing (the 13‑tag rule)
Etsy gives every listing one title + 13 tags (each tag ≤ 20 characters). How to use the results:
- Tags = your best long‑tail phrases. Pick high‑opportunity multi‑word keywords (grade A/B, and breakable if your shop is newer) and use them as tags verbatim — long‑tail terms match buyer intent and face less competition than head terms. Make each tag a distinct phrase; don't waste tags repeating the same single word.
- Title = strongest phrases first. Etsy weights words near the start of the title, so lead with your 2–3 highest‑opportunity phrases, then add variations.
- List in the right place. Each keyword's
category(plusprice_tiers/avg_price) tells you the right category and price band. - Chase winnable, not just popular. Sort by opportunity or filter to grade A/B with low competition — the
verdictand breakable flag tell you whether a high‑demand term is actually enterable, not just busy.
Output
Besides the dashboard, the dataset holds one clean row per scored keyword (export JSON / CSV / Excel / JSONL) with pre‑built views: Opportunities, Demand evidence, Competition evidence, Niche profile, 🔄 Reverse keyword (grouped by source shop/listing), and All columns (ordered).
Reverse rows carry source_listing_title, source_listing_id (and source_shop in whole‑shop mode); type is reverse_keyword vs keyword for seed rows.
OUTPUT.csv in the key‑value store is pre‑built keyword‑first and sorted best‑opportunity. TRENDING_AND_POPULAR holds Etsy's current popular searches, trending terms, trending products and gift‑guide themes (also shown in the dashboard).
Sample keyword row:
(Reverse/whole‑shop rows add source_listing_title, source_listing_id, source_shop.)
Speed & limits
| Run shape | Time |
|---|---|
| 1 seed, depth 1 (~17 keywords) | ~20–30s |
| 1 seed, depth 2 (~40 keywords) | ~1 min |
| 🔄 1 reverse listing (~8 related searches) | ~10–15s |
| 🏪 whole shop | ~3–5s per listing scanned |
Autosuggest expansion and per‑keyword metrics run concurrently. Demand numbers are live and shift as carts and sales change — re‑run to track a niche over time.
FAQ
Why isn't there a "search volume" number? Etsy doesn't publish true keyword search volume — every tool that shows one is estimating it. Instead this reads Etsy's own demand signals: live in‑cart counts, the share of top listings sold in the last 90 days, and a keyword's position in Etsy autosuggest. That's measured buyer demand, not a guess.
Are these the same as Google keywords? No. Etsy is a buyer‑intent marketplace, so the metrics come straight from Etsy (carts, badges, listing counts, price tiers) — not Google search volume or CPC, which don't reflect how people shop on Etsy.
Is the "competition" score actually actionable? Yes. Every keyword gets a plain‑English verdict, a breakable flag (do fresh listings still rank?), and a "who you're up against" breakdown (bestseller %, the niche's review "trust wall") — so you know whether a term is worth chasing, not just a number.
Does it track seasonality? It surfaces Etsy's live trending feed and shows it in the dashboard, but it doesn't track historical month‑by‑month seasonality — the data is point‑in‑time and live. Re‑run periodically to watch a niche move.
Do I need an Etsy login or API key? No. No login, no proxies, no setup — just enter seeds, a competitor listing, or a shop and run.
⚠️ Unofficial. Not affiliated with, endorsed by, or sponsored by Etsy, Inc. "Etsy" is a trademark of Etsy, Inc., used here for descriptive purposes only.