

PageSpeed Remediation Backlog Builder
Pricing
from $10.50 / 1,000 remediation reports
PageSpeed Remediation Backlog Builder
Turn a PageSpeed Insights / Lighthouse audit batch into an evidence-linked remediation queue, one report per unique URL+strategy, with honest thresholds-crossed evidence and no invented ROI.
Pricing
from $10.50 / 1,000 remediation reports
Rating
0.0
(0)
Developer

Tim Zinin
Maintained by CommunityActor stats
0
Bookmarked
2
Total users
1
Monthly active users
a month ago
Last modified
Categories
Share
PageSpeed Remediation Backlog Builder — turn a PageSpeed Insights / Lighthouse audit batch into a structured triage queue
Feed it an existing PageSpeed Insights or Lighthouse audit batch and get back one evidence-linked remediation report per unique URL and strategy — thresholds crossed, opportunities, and a next action, never an invented score.
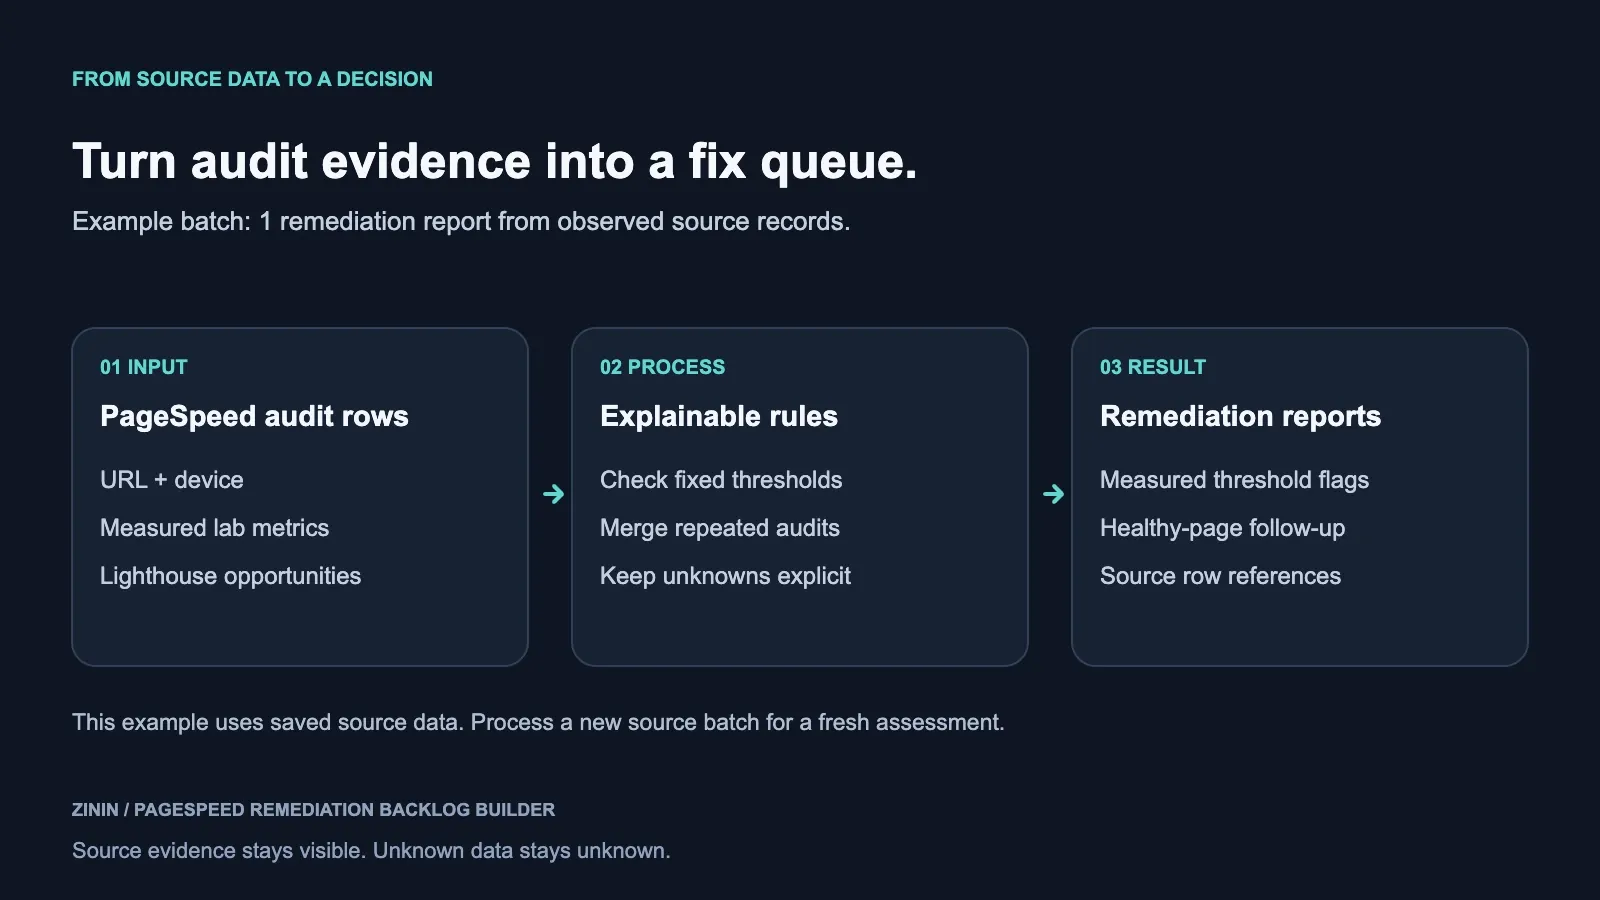
This Actor does not measure websites. It reads an existing audit batch — from a PageSpeed Insights / Lighthouse crawler Actor's Dataset, from an Integrations payload, or from rows you paste in directly — and converts raw lab metrics into a triage queue an SEO agency, an in-house web performance team, or a dev shop can actually work from: which pages need attention this week, which metric crossed which threshold, and what the source's own Lighthouse opportunities suggest doing about it. A healthy page produces a real "keep monitoring" report, not silence, and every conclusion is traceable back to the exact source row and the exact threshold it crossed.
What you get
For each usable distinct url + strategy (mobile or desktop) pair processed within the source-row, result-count and charge limits, you get one remediation report containing:
- The measured lab metrics actually present in the source row —
performanceScore(0..1), Largest Contentful Paint (LCP), First Contentful Paint (FCP), Total Blocking Time (TBT), Speed Index (SI) in milliseconds, and Cumulative Layout Shift (CLS, unitless). A metric the source never captured isnull, never a fabricated zero. - A band per metric —
good,needs_improvement, orpoor— against one disclosed, fixed threshold set (thresholdModel: "fixed-conservative-v1"), applied identically whether the source row was captured on mobile or desktop. status: "maintain"when nothing measured crosses a threshold, orstatus: "remediate"when at least one does, plus a plain-Englishactionrecommending either "keep monitoring" or source-listed fixes pulled from the source's own Lighthouse opportunities (never invented).topOpportunities— the source's own named Lighthouse opportunity audits and, only when the source explicitly reported it in milliseconds,estimatedSavingsMs. No bytes-to-milliseconds guessing, no additive "total time you could save" rollup.- A
confidencelevel (high/medium/low) based on how many of the six lab metrics were actually present and valid — so a report built from a thin, partial source row is never presented with the same confidence as a full one. - Full evidence — every measured metric, its band, its value and unit, and (when applicable) why a metric was excluded (out-of-range, conflicting declared unit) — plus which exact source rows the report was built from.
- Free diagnostics explain invalid source rows and processing limits. The initial list combines business diagnostics and source-read notices, with at most 200 entries written. Later result-size and result/budget-cap notices can raise total free rows above 200.
Reports follow the first occurrence of each URL+strategy in the accepted source rows. Lighthouse opportunities retain source order; the action names the first three available entries. The Actor does not calculate a cross-page priority score or re-rank those opportunities. Use the structured threshold evidence to apply your own ticket priority rules.
Who uses it
SEO agencies use these records to review an existing client audit batch and prepare source-linked technical recommendations. Engineering teams can export measured threshold crossings and the source's own opportunity names into a backlog. Operations teams can route the same structured records into CSV, reporting or ticketing workflows without adding an LLM interpretation step.
The buyer must already have compatible PageSpeed Insights or Lighthouse data. This Actor neither crawls the target pages nor supplies field-user experience data. Its confidence labels describe measurement coverage; they do not predict SEO gains, conversion lift or the result of a particular fix.
How to run
- Console (fastest for a one-off run). Open the Actor, go to Input, and either paste your audit rows into Audit rows (inline) or fill in Source Dataset with the Dataset ID from your PageSpeed Insights / Lighthouse audit run. Leave everything else at its default and hit Start.
- From an existing audit run's Dataset. If you already ran a PageSpeed Insights / Lighthouse Actor and have its Dataset ID, put it in
datasetId. The Dataset is read with your run's existing or resource-picker-authorized permissions; a raw Dataset ID does not itself grant access. - Chained after an upstream audit Actor via Integrations. Add this Actor as an "Actor/task run" integration on your upstream audit Actor. Apify's Integrations UI auto-populates the payload with
{{resource.defaultDatasetId}}; map that value into this Actor'sdatasetIdfield explicitly (see Integration recipes below) so the platform can request scoped read access underLIMITED_PERMISSIONS; private access still needs authorization. - Via the API. Call
POST /v2/acts/9TMryqYPPxu1KDDnw/runs(orrun-sync-get-dataset-itemsfor a synchronous single call) with a JSON body containingdatasetId(oritems) and, if you want a hard spending ceiling, the run optionmaxTotalChargeUsd. - Read the results. One row per unique
url+strategylands in the run's default Dataset. A matching run-levelOUTPUT/SUMMARYrecord in the Key-value store tells you how many were delivered, how many were free diagnostics, and whether the run hit a row cap or a spending cap before finishing.
Every run is independent — this Actor does not remember a previous run's results, so re-running against the same source batch reprocesses and rebills it (see Operating guide for what that means for your workflow).
Pricing
Pay-per-event, one event type: result-found — a delivered remediation (or maintain) report. There is no start fee and no charge for a run that produces zero useful reports; every diagnostic (invalid row, unrecognized strategy, budget stop, empty batch) is free.
| Tier | Price per report | Discount |
|---|---|---|
| Free (default) | $0.015 | — |
| Bronze | $0.0135 | 10% |
| Silver | $0.012 | 20% |
| Gold | $0.0105 | 30% |
| Platinum | $0.0105 | 30% |
| Diamond | $0.0105 | 30% |
The applicable discount tier is assigned by Apify to the running account; this Actor reads that tier from platform pricing. See Apify's discount-tier documentation. With maxResults raised to 80 and a sufficient run charge limit, a 40-URL × 2-strategy batch (80 possible reports) costs at most 80 × $0.015 = $1.20 at the Free tier before deduplication, and typically less once identical url+strategy pairs across duplicate source rows collapse into one billed report.
Set the platform's own Max total charge (USD) run option to cap total spend for a single run. If your remaining charge limit cannot cover even one more report's price, the run stops delivering and finalizes as budget_stopped — it does not deliver a partial-priced report and does not silently keep going past your cap. See Evidence and boundaries for exactly how that boundary behaves, including a documented case where an unusual input value did not behave as some buyers might expect.
Input contract
| Field | Type | Default | Notes |
|---|---|---|---|
items | array (JSON editor), max 1000 entries | prefilled example | Inline audit rows. Ignored if datasetId, runId, or a resolvable payload.resource is also given. |
datasetId | string (Dataset picker, READ) | — | Dataset ID from a PageSpeed Insights / Lighthouse audit run. Read with your own run's permissions. Overrides inline items. |
runId | string, max 64 chars | — | An Actor run ID to read instead of a Dataset ID directly; its default Dataset is resolved for you. Only used when you have a run ID but not its Dataset ID. |
payload | object (JSON editor) | {} | Set automatically by Apify's Integrations "Actor/task run" template. Carries {{resource}} (id, defaultDatasetId, actId) from an upstream run. |
maxInputRows | integer | 100 | Hard cap on source rows read (1–1000), before deduplication by url+strategy. |
maxResults | integer | 10 | Maximum number of paid reports this run can deliver (1–1000), independent of the platform's Max total charge run option. |
Source precedence, exactly: an explicit datasetId or payload.resource.defaultDatasetId (they must agree if both are present) beats a runId or payload.resource.id, which beats inline items. A dataset/run source is never merged with inline rows — one or the other. A malformed or conflicting reference (two different dataset IDs, a dataset that doesn't correspond to a given run ID) is rejected as invalid input, never silently downgraded to the inline/demo rows.
Accepted row shapes (the flat shape is the verified reference upstream output; the native shape is a separate supported input contract): a flat/normalized row with url (or finalUrl/input), strategy, performanceScore, LCP/FCP/TBT/SI/CLS, topOpportunities, fetchTime/checkedAt, and optionally metricUnits declaring each metric's unit explicitly; or a native PageSpeed Insights v5 lighthouseResult payload passed through unmodified (lighthouseResult.finalUrl, .configSettings.formFactor, .categories.performance.score, .audits["largest-contentful-paint"].numericValue, etc.). You do not need to reshape one format into the other — both are read directly.
Hard read bounds, always enforced regardless of maxInputRows: at most 1000 source rows, at most 100 rows fetched per page, at most 4 MiB of total source JSON per run, at most 64 KiB per individual row (an oversized row is dropped and disclosed, not silently truncated mid-field). This Actor reads only the fixed https://api.apify.com origin with your run's own token — it never fetches an arbitrary URL, never follows a redirect, and never starts an upstream Actor.
Output examples
Example 1 comes from the current real-remediation verification build; examples 2–4 retain their actual earlier build 0.1.1 control-run records. JSON formatting is condensed for readability; the field values match the saved Dataset records. Input snippets contain the actual Actor input, without run-control bookkeeping. Later integration templates are configuration recipes, not captured execution results.
1. A measured slow page — one paid remediation report
This real BBC mobile audit was measured by the upstream PageSpeed actor on 2026-09-23. The source reports a performance score of 0.56, LCP about 7.17 seconds and five Lighthouse opportunities. This downstream Actor preserves the measurements, identifies the crossed thresholds and builds an action from the source opportunity names. It does not make a new measurement or promise the suggested work will improve a particular score.
The saved default input contains the unchanged successful source row below. The upstream collection also returned an unsuccessful New York Times audit; that failed row was excluded from this small default example, without inventing its missing metrics.
Actor input:
Dataset output (the complete one-report Dataset):
The source run was QqpnGsn4OJ6cewmcp of zinin/google-pagespeed-insights-bulk-auditor. This saved row was processed in downstream run CzFlnJv9HaO9RYbYA, build 0.1.7 (jMDPSeY5jhMght9Cq), with one delivered result and one confirmed result event. observedAt preserves 2026-09-23T05:03:03.710Z; processedAt records the separate downstream execution. These verification runs are the owner's expense, not customer sales. Reusing this saved input does not refresh the measurements.
2. Partial-column projection — a separate healthy audit, deliberately reduced
This example demonstrates incomplete-column handling. It is not a fresh measurement of example.com — it uses a separate real 2026-09-18 healthy audit of example.com, deliberately reduced to just url, strategy, LCP, FCP, and fetchTime (dropping performanceScore, TBT, SI, CLS, and the Lighthouse version) and supplied inline, to show what happens when a source only carries some columns.
Actor input:
Dataset output (one report, partial: true):
Only two of six metrics were present, so confidence drops to medium, businessPartial/partial flip to true, and the four missing metrics are null — never estimated, never treated as "good" by omission. This is the honest, correct behavior for any source that only carries a subset of the full metric set (a common case when an upstream Lighthouse run only requested certain audit categories).
3. Below-price run — free budget_stopped diagnostic, no partial charge
Actor Dataset output when the platform's own charge limit for the run cannot cover even one report's price:
This run was started with the platform run option maxTotalChargeUsd: 0.005 — below the $0.015 Free-tier price of a single report. The Actor never reads the source batch, delivers zero paid reports, and writes this one free diagnostic row. Read Evidence and boundaries before relying on maxTotalChargeUsd = 0 specifically as a hard "never spend anything" switch — it does not behave the way that value's name suggests.
4. Empty batch — free no_results diagnostic
Actor input:
Dataset output:
An empty or entirely-unusable source batch is a free diagnostic, not a silent zero-row success and not a charge.
Field dictionary
| Field | Type | Meaning |
|---|---|---|
entityId | string | Stable key for this report: "<url>::<strategy>". |
found | boolean | true on every billed report row; false on every free diagnostic row. |
status | string | "maintain" (no threshold crossed) or "remediate" (at least one crossed) on a report; a diagnostic reason code (invalid, invalid_input, source_unavailable, budget_stopped, no_results, max_results_reached, result_dropped_oversized, source_rows_dropped, partial_source) on a free row. |
url | string | Canonicalized page URL (fragment dropped, one trailing slash normalized) grouped for this report. |
strategy | string | "mobile" or "desktop", as reported by the source. |
performanceScore, LCP, FCP, TBT, SI, CLS | number or null | The six lab metrics. null means genuinely absent or out of its physically valid range — never zero. |
metricUnits | object | The unit each metric is reported in (ms for LCP/FCP/TBT/SI, unitless for CLS). |
thresholdModel | string | Always "fixed-conservative-v1" in this build — the exact, disclosed threshold set applied (see Evidence and boundaries). |
evidence | array | One entry per metric actually evaluated: { metric, band, value, unit }, plus a reason when a present value was out of range or its declared unit conflicted with the expected one. |
thresholdsCrossed | array | The subset of evidence entries banded needs_improvement or poor — the metrics actually driving a remediate status. |
topOpportunities | array | The source's own named Lighthouse opportunity audits, each { id, title, estimatedSavingsMs? }, capped at 20 and flagged opportunitiesTruncated if more existed. |
action | string | Plain-English next step: "keep monitoring" for maintain; either the first three source-listed opportunities or "remediate the crossed thresholds" (when the source supplied no opportunity list) for remediate. |
confidence | string | high (4–6 of 6 metrics valid), medium (2–3), or low (0–1). |
partial / businessPartial | boolean | businessPartial is this module's own signal (missing metrics, missing timestamp, a conflicting duplicate, or a truncated list). partial also folds in run-level source-read incompleteness (a byte/row cap hit, dropped oversized rows) — check partial if you only check one flag. |
conflictingDuplicate | boolean | true when two or more source rows for the same url+strategy disagree on a measured value; the newest valid timestamp (else the first-seen row) was used. |
dedupedRowCount | number | How many source rows collapsed into this one report. |
sourceRowIndexes / sourceRowIndexesTruncated | array / boolean | Original source row positions this report was built from (capped at 50; the true count is still in dedupedRowCount). |
sourceCoverage | object | Run-level: { complete, reason, droppedOversized } — whether the source read itself hit a cap before this report was even built. |
sourceDatasetId, sourceRunId, suppliedSourceRunId, sourceRunIdVerified | string/null, boolean/null | Where this batch came from. sourceRunId is populated only when independently verified to match the Dataset; a supplied-but-unverified run ID is kept separately in suppliedSourceRunId with sourceRunIdVerified: false, never silently promoted. |
observedAt | string (ISO 8601) or null | The source's own measurement/fetch timestamp — never this run's own clock. |
processedAt | string (ISO 8601) | When this Actor processed the row. Always present. |
reason | string | Present on free diagnostic rows only: the specific reason a row was rejected or a run stopped. |
Reading the run summary
OUTPUT and SUMMARY contain the same run record when both writes succeed. These counters describe acknowledged processing, not every storage side effect that might have happened during a failed request:
| Field | Meaning |
|---|---|
schemaVersion, product, outcome, processedAt | Contract version, product, outcome and processing time. |
replaySafety | Reminder that a new run can bill again. |
requested | Number of source rows encountered by the source reader. It is zero if the budget precheck stopped before reading. |
usefulResults | Useful result rows remaining after oversized-result filtering, before delivery caps. |
delivered | Useful Dataset writes for which the complete delivery and charge check succeeded. |
paid | Confirmed named result-found events in this platform run. |
free | Acknowledged diagnostic Dataset writes without a named result event. |
failed | Oversized useful result rows dropped before delivery; this is not the count of fatal exceptions. |
fatalFailure, errorCode | Whether the run failed and its fixed diagnostic code. Input-policy diagnostics can succeed with a non-null errorCode, so read both fields. |
deliveryUncertain | A Dataset write or event-charge acknowledgment could not be confirmed. Actual Dataset rows may exceed confirmed counters. |
replayBlocked | The same run/storage already had a processing claim or named result events, so automatic replay was refused. |
budgetStopped, resultsCapped | Delivery stopped because of the effective charge allowance or maxResults. |
sourcePartial, sourcePartialReason, sourceDroppedOversized | Source-read coverage limits and rows discarded for size. |
businessPartialResults | Useful transform results carrying incomplete business evidence, counted before delivery filtering. |
oversizedDiagnosticsDropped, diagnosticsTruncated | Diagnostics omitted because of size or the 200-entry combined business/source-notice limit; later result-size/cap notices are outside it. |
partialOverall | At least one source, output, diagnostic or business-coverage limit was recorded. It does not replace fatalFailure. |
budgetMode, maxTotalChargeUsd | Verified finite/unlimited limit mode; the limit is null when no finite verified limit is available. |
businessSummary | Module counts such as unique reports, maintain/remediate reports and invalid source rows; these can exceed delivered rows when a run cap stops delivery. |
Free Dataset status: "invalid_input" identifies an invalid source reference or Actor input. source_unavailable identifies a source that could not be read and accompanies a failed run. invalid identifies an individual uninterpretable audit row; its reason explains the issue. The remaining free statuses listed in the dictionary disclose empty results, spending/result caps, oversized results, dropped source rows and partial source reads. Diagnostic rows carry no remediation claim about a website.
Evidence and boundaries
Explicit found:false, failed:true, or a failed/error/timed-out/aborted source status always produces a free diagnostic, even alongside contradictory found:true, partial:true flags. Only a soft error/errors warning without a hard failure may survive when the row explicitly reports found:true, partial:true.
Threshold model — fixed-conservative-v1, disclosed and fixed, not a certified score. LCP and CLS are Google's own published Core Web Vitals boundaries and are strategy-agnostic. FCP, TBT, and Speed Index are Lighthouse lab diagnostics, not Core Web Vitals — and Lighthouse's real scoring curves for TBT and Speed Index genuinely differ between its mobile and desktop presets. This Actor does not model that difference: it applies one fixed threshold set to both strategies and labels every report with the exact model name used, rather than presenting an unqualified "Lighthouse score."
| Metric | Unit | Good (≤) | Needs improvement (≤) | Poor (above) |
|---|---|---|---|---|
| LCP | ms | 2500 | 4000 | 4000 |
| FCP | ms | 1800 | 3000 | 3000 |
| TBT | ms | 200 | 600 | 600 |
| Speed Index | ms | 3400 | 5800 | 5800 |
| CLS | unitless | 0.10 | 0.25 | 0.25 |
| Performance score | 0..1 | ≥ 0.90 | ≥ 0.50 | below 0.50 |
Lab measurements only. Nothing in this Actor's output is real-user/field data from the Chrome UX Report — every number here is a lab measurement from the source's own PageSpeed Insights / Lighthouse run. A "good" lab result here is not the same claim as a passing Core Web Vitals assessment based on real user traffic.
A metric out of its physically valid range is excluded, never coerced. A performanceScore outside 0–1, or a negative LCP/FCP/TBT/SI/CLS value, is dropped from that report's evidence and band calculation entirely (with the invalid value and reason still disclosed in evidence) — it is never read as "poor" by clamping, and never silently treated as a healthy 0.
Declared units are honored, and conflicts are excluded. If a source row explicitly declares a metric's unit (metricUnits) and that declaration doesn't match the metric's expected unit (milliseconds for LCP/FCP/TBT/SI, unitless for CLS), that metric is excluded from the report and the conflict is recorded in evidence with reason: "conflicting_declared_unit" — a mislabeled source field is never silently trusted at face value.
Deduplication and conflicts. Reports are grouped by exact url (canonicalized) + strategy. When multiple source rows exist for the same pair, the row with the newest valid source timestamp (fetchTime, otherwise checkedAt) wins; if no row has a parseable timestamp, the first-seen row wins. If any two rows for the same pair disagree on a measured value, conflictingDuplicate is set to true and the report is marked partial — this is disclosed, not hidden inside a silently-averaged number.
Bounded, disclosed caps. topOpportunities is capped at 20 per report (opportunitiesTruncated if more existed); sourceRowIndexes is capped at 50 per report (dedupedRowCount still reports the true total); source reads are capped at 1000 rows / 100 rows per page / 4 MiB total / 64 KiB per row. Every cap that actually triggers is disclosed in the output, never silently applied.
Savings are only ever the source's own stated milliseconds. estimatedSavingsMs on an opportunity is populated only from an explicit, documented milliseconds field in the source (Lighthouse's overallSavingsMs, or a numeric value the source itself explicitly typed as "millisecond") — never a generic numericValue (which on other Lighthouse audit types is bytes, not time) and never summed across opportunities into a single "total time saved" figure, since Lighthouse opportunities are not strictly additive.
Budget behavior. The recorded positive-below-price canary delivered zero paid reports and one free budget_stopped notice before reading the source. A separate literal-zero API request was normalized by Apify to an account-level remaining allowance and delivered a paid report. These are observations of those runs, not a promise of immutable platform behavior. Set a positive maxTotalChargeUsd, inspect the effective options.maxTotalChargeUsd and isMaxTotalChargeUsdSetByUser returned after start, and stop/reconcile if the platform changes your cap. Do not use API maxTotalChargeUsd: 0 as a no-spend switch. A small positive cap below the applicable result price exercises the no-paid-result path when that effective cap is preserved.
No replay/dedup across runs. Every run is independent processing. Re-running against the same source batch — even the identical Dataset — is billed again; this Actor does not remember or deduplicate against a prior run's results. A within-run resurrection guard exists (an already-started run that crashes mid-processing will not silently restart and re-bill on its own), but that is not the same thing as cross-run deduplication.
Uncertain outcomes fail closed with a safe message, never a guaranteed-delivered claim. If the platform's own pricing, charge-limit, or event-counter state cannot be verified during a run — for example, a transient read failure on the run's own charge counters — that run finalizes as FAILED with a plain-language explanation rather than claiming results were "delivered" when that could not actually be confirmed. If this happens, inspect the original run (its Dataset and its OUTPUT/SUMMARY Key-value store record) before deciding whether a manual retry is warranted — a FAILED outcome does not by itself tell you whether zero, some, or all expected reports were actually written and charged.
The SDK delivery call is not a transaction spanning storage and charging. Dataset write happens before the named-event charge. A lost response can therefore leave an unconfirmed row in the Dataset. The Actor stops without retry on that ambiguity and ends FAILED; it does not promise exactly-once delivery or billing across services. Confirmed summary counters can be lower than the raw Dataset item count on such a failed run.
Decision routing
Use status, thresholdsCrossed, and confidence together, not status alone:
status: "maintain",confidence: "high"— genuinely healthy on every metric that was measured. File it, move on; re-check on the next scheduled audit.status: "maintain",confidence: "medium"or"low"— nothing measured crossed a threshold, but fewer than 4 of 6 metrics were actually present. Treat as "no evidence of a problem" rather than "confirmed healthy" — flag for a fuller audit pass if this URL matters commercially.status: "remediate",thresholdsCrossedincludes LCP or CLS — the lab measurement crossed this Actor's disclosed LCP or CLS threshold. Review the source opportunities, reproduce the issue, and check field data separately before making a Core Web Vitals claim.status: "remediate",thresholdsCrossedis only TBT/FCP/Speed Index — a measured lab threshold crossing, but remember these three use one fixed threshold set applied to both mobile and desktop (see Evidence and boundaries) rather than Lighthouse's own strategy-specific scoring curve — treat as a strong lab signal, not a certified per-device score.conflictingDuplicate: true— your source batch itself contains disagreeing measurements for the same URL+strategy (e.g. two crawl passes with different results). Investigate the source data before acting on the report; the report used the newest valid timestamp, but the disagreement itself is worth understanding.partial: truewith a lowconfidence— a thin source row. Useful as an early flag, but schedule a fuller audit pass before treating it as the final word on that page.- Free diagnostic rows (
found: false) — never a signal about the page itself.status: "invalid"withreason: "missing_url"or"missing_or_unrecognized_strategy"means the source row couldn't be interpreted at all;no_lab_metrics_present/all_metrics_out_of_rangemean the source row had an identity but nothing measurable;budget_stopped/max_results_reachedmean the run's own caps were hit before all useful reports could be delivered — inspect what was delivered before processing the remaining batch; starting the same batch again bills its reports again.
Commercial playbooks
Recurring client triage. Chain a new upstream audit into this Actor and export remediate rows into your ticketing system. Apply business priority outside this Actor: it groups URL/device reports and discloses threshold crossings, but does not rank pages by revenue or implementation effort.
Engineering review. Use the original metric, band and opportunity name as the starting point for a reproducible ticket. Verify the recommendation against the actual application before scheduling work.
Client reporting. Keep the source observation date beside every report. Comparing two batches is an external workflow; this Actor does not join a baseline, control audit conditions or attribute a score change to work performed. Reprocessing an unchanged snapshot adds no fresh evidence.
Integration recipes
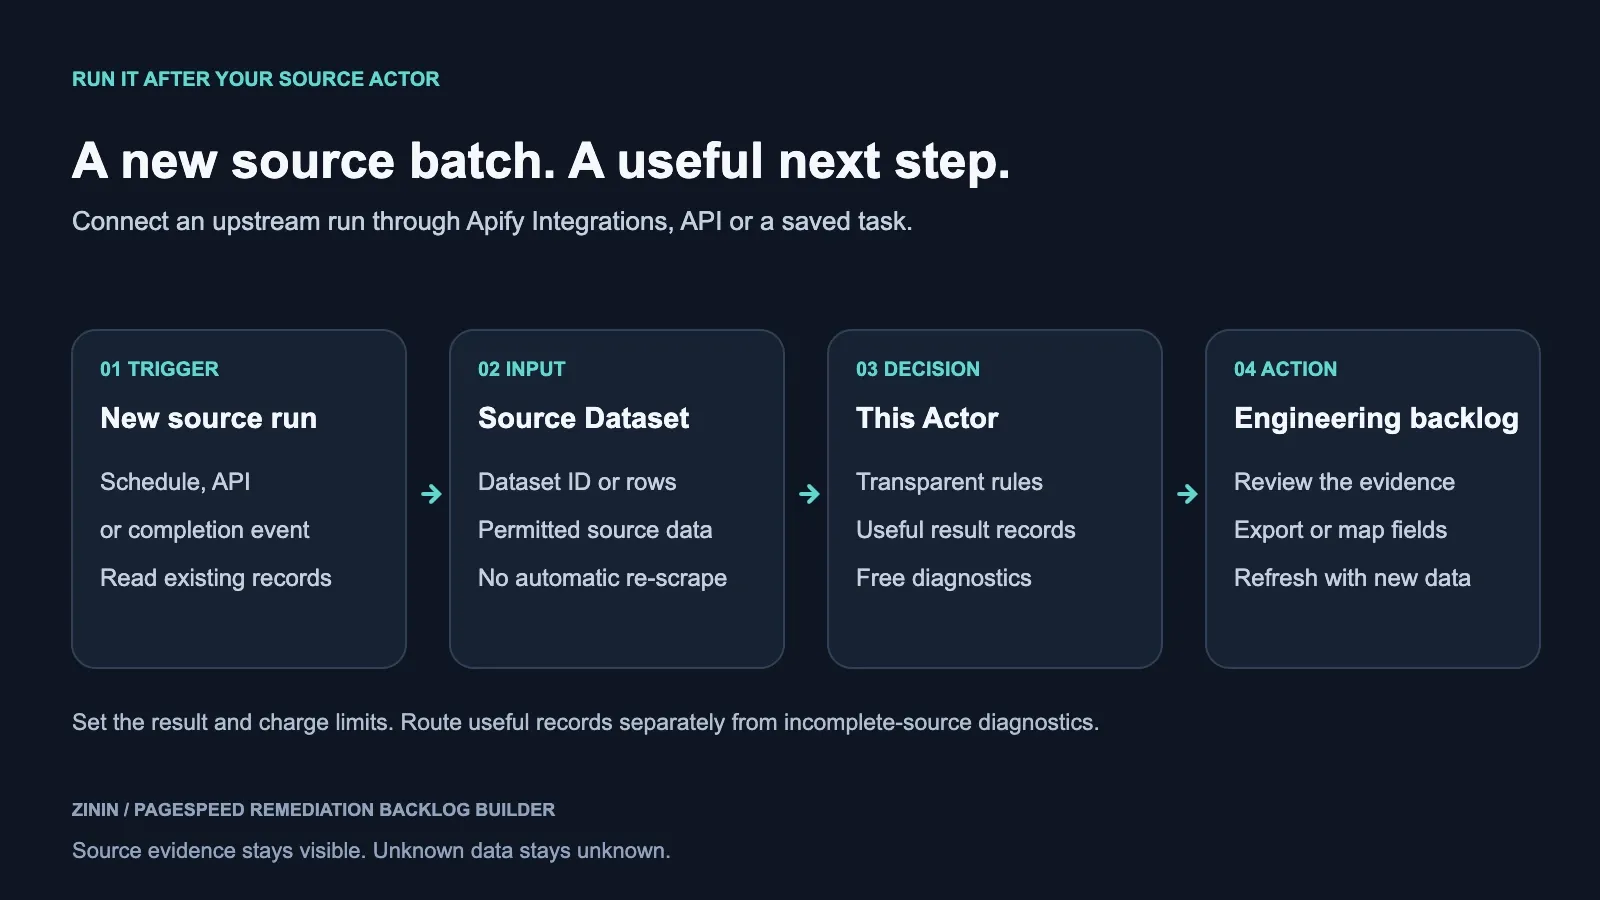
This Actor's ID is 9TMryqYPPxu1KDDnw. The reference upstream audit Actor referenced throughout this README is zinin/google-pagespeed-insights-bulk-auditor; any Actor or process producing the same row shape (see Input contract) works identically.
1. Console-native chaining (no code). On your PageSpeed Insights / Lighthouse audit Actor's run page, open the Integrations tab, add an "Actor/task run" action targeting this Actor, and let Apify's Integrations UI populate the payload — it automatically carries {{resource.defaultDatasetId}} from the finished upstream run. Map that value explicitly into this Actor's datasetId field (rather than relying on the generic payload pass-through alone) so the resource picker can request an explicit READ grant on the Dataset under LIMITED_PERMISSIONS. See Actor integrations.
2. API-level integration (isApifyIntegration). For a programmatic integration outside the Console — following Apify's API integration contract — set isApifyIntegration: true and shouldInterpolateStrings: true on your webhook/integration definition, and supply payloadTemplate as a JSON string with quoted template variables, e.g.:
Submit this definition to POST /v2/webhooks using your account's Authorization header and Content-Type: application/json; see Create webhook. It targets the reference upstream Actor ID zLjpMDTcawdSa8w1L; replace that ID when you use another compatible source. Inject the <APIFY_TOKEN> credential into headersTemplate from your secret store during provisioning, never from a public Dataset or README. The token must have the access your workflow needs. doNotRetry: true prevents an automatic second downstream start after an ambiguous dispatch; inspect webhook dispatch status before a manual retry. The $0.15 positive run cap covers at most ten reports at the listed base price; verify the effective cap returned by the platform. This is a configuration template, not a captured webhook execution.
The target run-creation call uses this Actor's ID (9TMryqYPPxu1KDDnw), e.g. POST https://api.apify.com/v2/acts/9TMryqYPPxu1KDDnw/runs. Note datasetId is set explicitly alongside payload.resource.defaultDatasetId — both point at the same Dataset — so Apify can authorize the Dataset through the schema's resourcePicker READ declaration. The JSON key itself does not grant access: your run needs platform-authorized resource input or pre-existing access under its scoped token. A private Dataset can still return a permission failure. The webhook-shaped public-Dataset canary does not prove private-resource authorization.
3. Direct webhook recipe. Configure a webhook on your upstream audit Actor for the ACTOR.RUN.SUCCEEDED event, with a payload template equivalent to recipe 2 above, and a request URL of https://api.apify.com/v2/acts/9TMryqYPPxu1KDDnw/runs. Prefer an Authorization: Bearer <APIFY_TOKEN> header sourced from an environment variable in whatever system sends the webhook, over a token embedded in the URL — never put a token in a query string that might be logged.
4. Export / backlog mapping. Every run's Dataset supports the platform's standard export formats (CSV, Excel, JSON, RSS) directly from the Console or via GET /v2/datasets/{datasetId}/items?format=csv. Map url, strategy, status, thresholdsCrossed, action, and confidence into whatever ticketing or spreadsheet tool your team already uses — those six fields alone are enough to drive a remediation backlog view.
5. Generic automation tools (n8n, Zapier, Make). Use your automation tool's authenticated HTTP request action to call run-sync-get-dataset-items on this Actor's ID with a JSON body containing datasetId (from the upstream audit run) and your chosen maxResults/maxInputRows. This works identically to recipe 2 without needing native Apify-integration support in the automation tool, since it's a plain authenticated HTTPS POST.
The examples describe a user-configured integration. The input mapping was exercised in a cloud run with a webhook-shaped input; an installed upstream success trigger was not part of that check. Follow Apify's integration guide when enabling your workflow and confirm the first triggered run's Dataset and charge limit.
Operating guide
- Confirm that source identities, device strategies and metric units match the Input contract. Missing metrics remain unknown.
- Use a small real batch first. Set
maxInputRows,maxResultsand a positive platform charge limit appropriate to the work you want delivered. - Check the effective charge limit after starting an API run. A literal zero was normalized by the platform in the recorded test; use the documented positive below-price control when testing a free stop.
- Read
OUTPUTorSUMMARYalongside the Dataset. Confirm delivered/paid counts and inspect source incompleteness, result caps and diagnostic truncation. - Treat
partialreports and low coverage as a request for better source data. A healthy band for one measured metric is not proof that all unmeasured metrics are healthy. - Reconcile a failed run before retrying. Dataset writing and charging are separate operations; raw rows can exceed confirmed delivered counts. A new run can charge again.
- Refresh the upstream audit for a new observation. Keep source dates when exporting reports, and compare batches only with their audit conditions in view.
FAQ
Does this run PageSpeed Insights? No. It processes existing compatible rows. The default is a saved BBC audit, not a new measurement; provide a new upstream batch for current observations.
What do I pay for? One useful remediation report per unique URL and strategy, including a measured maintain report when nothing crosses a threshold. Free diagnostics request no result event. Prices for all six plan tiers are listed above.
Does maintain mean the whole page passed? Only the metrics actually present were assessed. Missing or invalid metrics remain unknown; consult confidence, coverage and partial fields before drawing a broader conclusion.
Is this a field Core Web Vitals verdict or an SEO forecast? No. These are supplied lab measurements interpreted with fixed, disclosed thresholds. TBT is not INP; lab CLS is not a field-percentile assessment. Confidence describes coverage, not a calibrated probability or commercial outcome.
Are opportunity savings guaranteed or additive? No. Only source-supplied information is retained. Opportunities may overlap, and potential savings are not measured improvements from completed work. No effort, ROI or dollar savings are invented.
How do I request a free stop? Set a positive effective platform charge allowance below the applicable result price, and verify the platform preserved it. Do not assume a raw API zero stays zero. The Actor's maxResults input is a separate delivery cap.
Why might a failed run contain rows? Dataset writing precedes charging and is not transactional. Inspect raw rows, event counters and available summaries before retrying. A new run can charge again; there is no automatic retry of ambiguous operations or cross-run deduplication.
Can another source work? Yes, if its actual fields, units and identities satisfy the adapter contract. A related-tool link does not guarantee compatibility or imply a partnership; validate a small real batch first.
Sources and rights
This Actor reads only authorized Datasets and runs; it never starts an upstream scrape. The inline prefill is the unchanged successful BBC mobile audit captured by zinin/google-pagespeed-insights-bulk-auditor on 2026-09-23 (run QqpnGsn4OJ6cewmcp, dataset VTGrx6ALiNdjZRGy1). Example 1 preserves its actual build 0.1.7 result. Examples 2–4 preserve historical build 0.1.1 controls based on the September 18 example.com audit (source dataset XbSq7f5hSDe8vAWfc, run LmalqUBxxFPnavvof, public curated copy p8f3jIUFtHPZQz96f). Saved timestamps and measured values remain unchanged; none of these examples implies a live re-measurement. Integration templates are configuration recipes.
Related tools
Related tools for adjacent workflows in AI and search visibility.
| Actor | What it does |
|---|---|
| Domain Health Checker | Pair it in the AI and search visibility workflow: Audit DNS resolution, MX, SPF, DMARC, name servers, and TLS for a list of domains |
| Google PageSpeed Insights Bulk Website Auditor | Pair it in the AI and search visibility workflow: Audit public URLs with Google PageSpeed Insights: lab performance scores, LCP, CLS, TBT, FCP, Speed Index... |
| Social Preview Checker | Pair it in the AI and search visibility workflow: Audit observed Open Graph and Twitter Card metadata for up to 100 authorized public pages |


