Monitoring
Pricing
Pay per usage
Monitoring

This actor monitors your actors' statuses, validates their datasets' data, and displays useful information in an interactive dashboard. And if something happens, you'll get notified via email or Slack.
4.4 (5)
Pricing
Pay per usage
14
Total users
160
Monthly users
3
Runs succeeded
39%
Issue response
5.5 days
Last modified
a year ago
Monitoring Suite
Manually tracking the results of your actors can be complicated and tiresome. Did they succeed? Have they produced the correct amount of results? Were those results valid? How does the amount of results evolve over time? Luckily, you don't need to visit Apify dashboard every day to answer those questions.
Monitoring suite is an easy to use tool that allows you to set up automated monitoring of your actors in no time. It can be used for simple tasks and complex projects spanning multiple actors and datasets as well.
Is this free?
The monitoring suite can be used free of charge, but under the hood, it is a system of actors that consume compute units. We've tried our best to make it as efficient as possible.
Consumption
For average projects, it will consume single digit amounts of CUs per month.
- Medium projects (single monitoring configuration with 5-20 daily running monitored tasks or actors) should consume around 10 CUs per month.
- Bigger projects (more monitoring configurations with more than 20 daily running tasks or actors) can monthly exceed 50 CUs+ consumption.
Quick start
- Click Try for free above to create a new task.
- You should see the What you want to monitor input section open.
- Give your monitoring suite a name under Monitoring suite name.
- Under Type of target select if you want to monitor an actor or a task.
- Fill the names of your actor or task under Target name patterns.
- Select Notify me whenever actor/task does not succeed.
- Click Run to enable your monitoring.
You can now sit back and relax knowing that whenever a run of your actor / task does not succeed, a notification will be sent to your email immediately.
How do I turn this off or make changes?
To turn off the selected monitoring suite, simply run the task with mode Delete configuration. It will clean
up all its resources and it will turn off all monitoring activities. You will no longer receive the notifications.
If you want to make any changes in existing configuration, just choose the Update configuration mode option,
make your changes and run the monitoring suite task again.
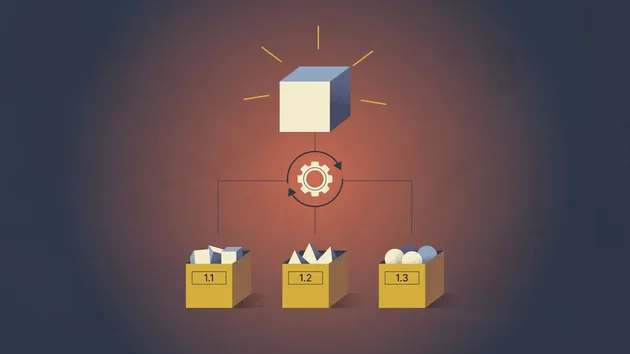
How it works
The monitoring suite is a complex system. Based on your configuration, it will create schedules and webhooks under your account and use those to trigger actor runs. Some will make sure that your data are correct, others will send you notifications.
All monitoring related resources will be prefixed with monitoring-. If you
start seeing a lot of those, it's expected. You can always turn off the monitoring
by following the steps above.
Targets
The quick start section gets you up and running in no time, but the monitoring suite is far more powerful. Let's look at targets first.
A target is something that you want to monitor. Currently, it can be:
- actor
- task
- dataset
Use the Type of target input field to make your selection. If you need to monitor multiple target types, you can create multiple monitoring suites.
Target name patterns
In most scenarios, you can just type in the name of the target you want to monitor into this input field and be done with it. But keep in mind that it's actually a regular expression that matches all targets of the selected type under your account. This is extremely useful to quickly select multiple targets to monitor. It is possible to add more than one pattern which can be useful to easily select more targets or in particular if the target type dataset is selected. It means that all the matched datasets are going to be automatically group by these patterns and visualization of their data will be much easier and well-arranged.
Imagine you have 3 actors, amazon-scraper, google-scraper and results-uploader.
By setting the pattern to scraper, you can quickly monitor both your scrapers.
If you want to monitor just one of them, provide the full name.
If you have actors my-actor and my-actor-2 and you want to monitor only
my-actor, use regular expression syntax ^my-actor$ to select only the first
one.
When you have named datasets as eshop-items-week-1, eshop-items-week-2 and
eshop-orders-week-1, eshop-orders-week-2 and you want to group your weekly
data by data category, just insert two patterns as eshop-orders and eshop-items.
Target IDs
If for whatever reason the Target name pattern option does not suit you, targets can also be specified by providing their IDs, as found in your Apify dashboard.
Checkers
Checkers are the bread and butter of monitoring. They collect different kinds of information about your targets and depending on your needs, you can use only one or all of them in your monitoring suite. You'll receive the information from checkers using the notifications.
When actors or tasks are used as targets, checkers that operate on datasets will automatically use their default datasets.
Check frequency
Each checker has a check / refresh frequency input, where you can specify
how often you want the checker to run. Critical issues with your
data are best reported immediately. The frequency input understands
natural cron language.
There are two basic options. Updating after each monitored run finishes or on a pre-set schedule.
Type the Per run, Each run or Every run to run the checker
immediately after your actor / task run finishes. To schedule updates, use plain English sentences
such as every day at 13:30 or every Monday at noon or at 8pm every 1st day of the month.
Note that dataset targets can't be checked per run.
For statistical checkers, such as the dashboard, we suggest scheduling regular (daily) updates.
Run status checker
Is the simplest checker we have. It doesn't even have its own section
and you turn it on by selecting "Notify me whenever actor/task does not succeed".
As the name suggests, it works only for actors and tasks and it will check for
runs that either FAILED, TIMED-OUT or ABORTED, so you'll never miss
a problem again.
Dashboard with statistics
With a dashboard, you can immediately see how your targets performed in easy to read charts and with up to 60 days history. This is especially useful to track trends in your data. Are you getting a consistent number of results or is it declining? Was there an unexpected drop? How often do my actors fail? The dashboard shows you all this information at a glance.
Dashboard data grouping
You can set grouping your target's data by name patterns if you do not want
to use default grouping by selected targets. All matched targets will then be
displayed as one data line in the dashboard charts. For example if you use the same
group of scraping actors for different countries as actor-1-cz, actor-2-cz and
actor-1-us, actor-2-us your patterns can be cz, us and all your your dashboard
will display 2 data lines - one for each state.
Schema checker
If you want to export your data to CSV or simply to keep high quality of data,
it's worth making sure that all the items in your dataset match a certain schema.
The schema checker uses the ow
syntax for its good balance of simplicity and versatility.
Besides validating the schema of individual items, the schema checker can also make sure that your datasets have a minimum or maximum number of items.
The checker measures the number of "clean" items in the datasets.
Validation options
The validation options specify your constraints. They are always an array of objects. This is to enable use of different schemas for different targets.
Properties
filter:string: select targets by matching name to a patterntargetIds:string[]: select specific targets by IDminItemCount:number: minimum amount of items in datasetmaxItemCount:number: maximum amount of items in datasetschema:object: validation schema for individual items
Examples
The following example will check whether your dataset includes at least
30 items and that all the items have a property foo of type String
and a property bar of type Number.
The next example uses an override to use different validations for one target. The target must be one of the monitoring suite targets. This is to enable more granular validation of previously selected targets, not to add more targets to the mix.
Using a filter to provide different validations for different targets.
This could be used if you selected scraper as your Target name pattern
in the first section of the input and now you need to split your scrapers
into different validation groups.
Duplicates checker
When scraping large amounts of data, duplicates will inevitably occur. This checker will let you know when that happens, and will point out the problematic items in your datasets. When used with actors / tasks, it will check their default datasets.
Make sure to set the Unique keys. The checker does not assert uniqueness
of whole dataset items, but only of values under the selected keys. For example,
if you are collecting the inventory of an online store, and the items in the
store are uniquely identified by a SKU (stock keeping unit), you would save
the SKU to your dataset under the key sku and then set sku as the Unique key.
Notifications
Notifications are the final step of the monitoring operation. They will deliver the information gathered by your checkers in a simple human readable format. By default, notifications will only be sent if something goes wrong. If you want to be notified for successful checks, select the given options under the individual checker sections.
Notification grouping
When there are more actor/task runs that would finish all at once or close each other grouping all the notification to one notification report instead of sending each of one separately could be nice. All the notifications that should come within 5 minutes range will be group if you set this option.
Email notifications are the default. You don't need to do anything and they will be automatically set up with your account email and a subject line that will tell you your monitoring suite's status at a glance.
You can disable email notifications, use a different email or a different subject line in the appropriate input fields.
Slack
For larger projects and for teams, using Slack notifications is often better than email. Monitoring suite will send reports to a channel of your choice, detailing the status of your suite. To set it up, you need a channel ID and a token.
Channel
This is easy. To send notifications to the notifications channel in your
Slack workspace, use #notifications.
Token
To access the channel, you need a token. There are various tokens that you can use and multiple approaches, depending on your Slack workspace. Visit the Slack authentication docs and perhaps ask the owner of your workspace for help with getting the right token.
What's next?
- automated grouping of related datasets in dashboard
- dataset content visualisation / checks
- key-value store content checker