Webhook Debugger, Logger & API Mocking Suite
Pricing
from $10.00 / 1,000 captured webhooks
Webhook Debugger, Logger & API Mocking Suite
Enterprise-grade webhook testing suite for developers. Capture, inspect, replay, forward, validate, and mock webhook traffic in real time without tunnels. Includes SSE live streaming, JSON Schema validation, and signature verification for Stripe, GitHub, Shopify, Slack, and custom HMAC workflows.
Pricing
from $10.00 / 1,000 captured webhooks
Rating
0.0
(0)
Developer
Ahmed Rehan
Maintained by CommunityActor stats
2
Bookmarked
7
Total users
0
Monthly active users
5 days ago
Last modified
Categories
Share

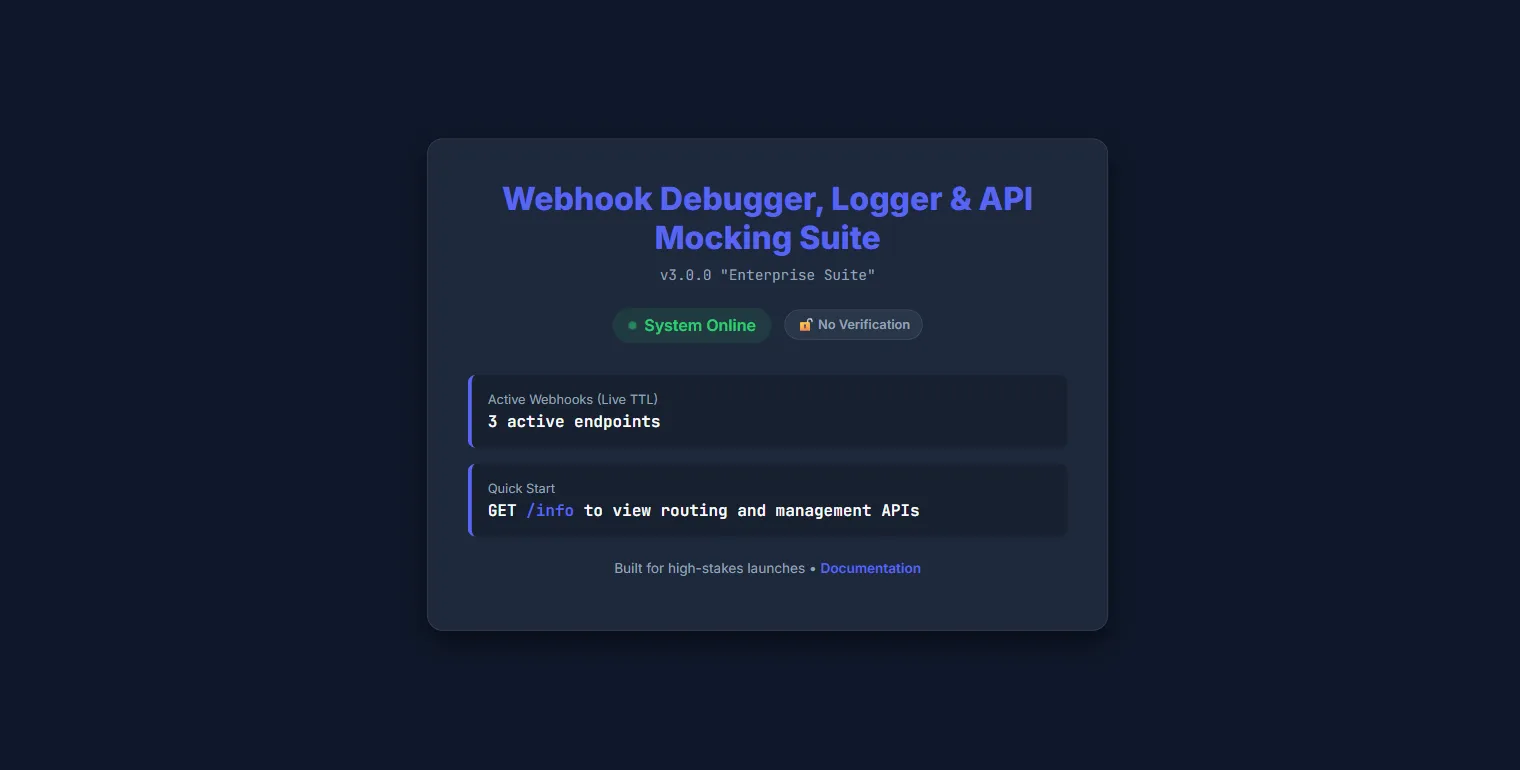
Generate temporary webhook URLs, inspect every incoming request, replay failures, and simulate callback behavior without tunneling localhost.
Status


![]()


Run & Docs
Sponsor
Contribute
Webhook Debugger, Logger & API Mocking Suite is an Apify Actor for testing webhook integrations end to end. It generates temporary endpoints, captures the full request envelope, exposes live and queryable logs, and lets you replay or forward captured traffic to another destination.
It is designed for developers working with providers such as Stripe, GitHub, Shopify, Slack, and custom internal webhooks who need more than a generic request bin.
[!NOTE] This actor is optimized for testing, debugging, replay, and callback simulation. If you need permanent public ingress or long-term retention, place it behind your own infrastructure or run the self-hosted container with persistent storage.
[!WARNING] Generated webhook URLs are public unless you enable
authKey,allowedIps, or signature verification. Do not point sensitive production traffic to unsecured endpoints.
Screenshots
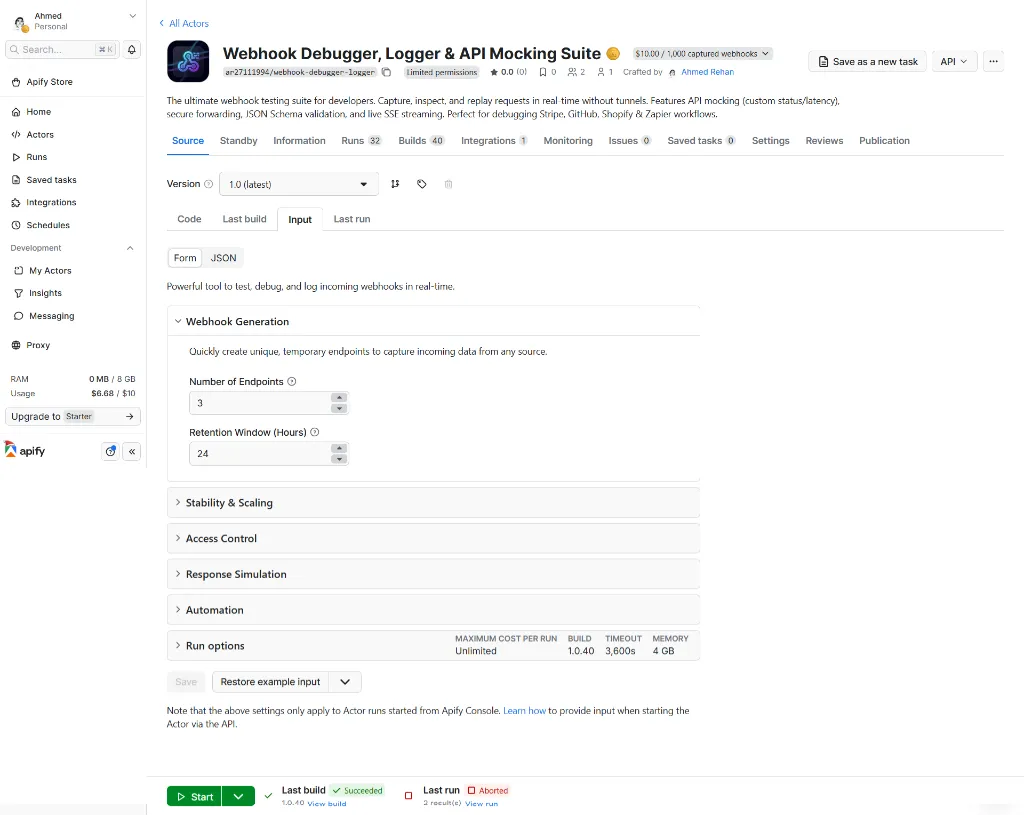
[!NOTE] The Apify Store input tab always reflects the most recently published build. To avoid showing stale configuration fields, this README documents input options from the current repo schema in .actor/input_schema.json and uses a live local runtime screenshot below.
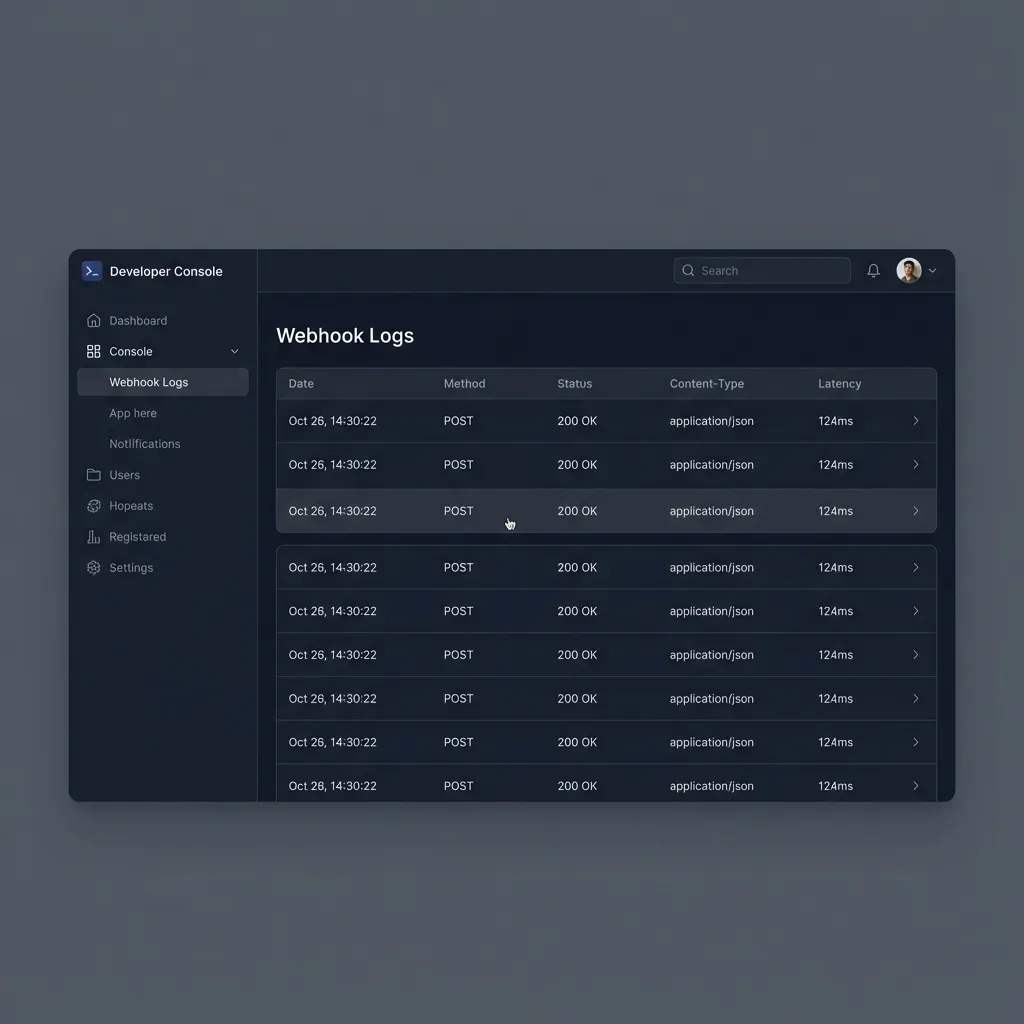
Built-in dashboard
Key input options
The current repo schema is defined in .actor/input_schema.json. These are the settings most users touch first.
| Input | Purpose | Default |
|---|---|---|
urlCount | Number of temporary webhook endpoints to generate | 3 |
retentionHours | How long generated webhook URLs remain active | 24 |
maxPayloadSize | Maximum accepted request body size in bytes; values above 100 MB are clamped | 10485760 |
enableJSONParsing | Parse JSON payloads into structured objects for search | true |
maskSensitiveData | Redact sensitive headers such as Authorization, Cookie, Set-Cookie, and API key headers from logs | true |
authKey | Protect management routes and optionally webhook ingest with a shared key | unset |
allowedIps | Restrict traffic to specific IPs or CIDR blocks | empty |
signatureVerification | Verify Stripe, Shopify, GitHub, Slack, or custom signatures | unset |
forwardUrl | Forward every captured request to another destination | unset |
defaultResponseCode | Return a custom HTTP status to the sender | 200 |
responseDelayMs | Add an artificial response delay after processing completes; accepted range is 0-10,000 ms and higher values are clamped | 0 |
jsonSchema | Reject payloads that do not match a JSON Schema | unset |
customScript | Transform or enrich the captured event before storage | unset |
What does this actor do?
This project gives you a disposable webhook test environment with a documented HTTP API.
It helps you:
- generate 1 to 50 unique webhook URLs for a run
- inspect headers, query params, payloads, response status, timing, IP, and signature state
- stream events live over Server-Sent Events (SSE)
- replay captured requests to a new destination
- forward incoming traffic to another endpoint with retries and circuit breaking
- simulate downstream behavior with custom status codes, response bodies, headers, and latency
- trigger Slack or Discord alerts when a webhook run needs attention
- handle large request bodies by enforcing size limits and offloading oversized accepted payloads to storage
- validate JSON payloads and run custom JavaScript transformation scripts before storage
- plug the actor into Apify-native workflows, API automation, and MCP-enabled tooling that orchestrates Apify runs and datasets
Why use it?
Webhook debugging is usually split across too many tools.
- You need one tool to expose a public URL.
- Another tool stores payloads.
- Another tool replays failures.
- Another tool simulates custom responses.
This actor combines those workflows in one place.
Problems it solves
- No more tunneling localhost just to inspect a payload.
- No more guessing what a provider actually posted.
- No more manually rebuilding failed callbacks for retries.
- No more separate mock server just to test response codes or latency.
Why teams pick it over a generic request bin
- It captures requests and exposes a searchable API, not just raw dumps.
- It supports replay and forwarding, not only passive logging.
- It can validate signatures for common webhook providers.
- It can alert Slack or Discord when capture, validation, or downstream delivery fails.
- It supports inline custom scripting for payload cleanup and transformation.
- It includes health, readiness, and metrics endpoints for operational setups.
- It can run on Apify or as a self-hosted Node/Docker service.
- It resumes background Dataset-to-DuckDB sync cleanly across stop, retry, and restart paths, which keeps self-hosted and test harness restarts predictable.
What can this actor do?
| Feature | What you get |
|---|---|
| Temporary webhook URLs | Generate 1-50 unique endpoints per run with configurable retention |
| Full request capture | Method, headers, query, body, response body, response headers, size, latency, IP |
| Searchable logs | DuckDB-backed /logs queries with pagination and detailed retrieval |
| Live streaming | Real-time event feed over /log-stream using SSE |
| Replay workflows | Replay a captured request to a different target URL |
| HTTP forwarding | Forward every incoming request to a destination with retries and circuit breaker protection |
| API mocking | Return custom status codes, headers, bodies, and artificial latency |
| Alert notifications | Send Slack or Discord notifications for error, 4xx, 5xx, timeout, or signature_invalid events |
| Security controls | Global API key, IP allowlist, sensitive header masking, provider signature verification |
| Large payload handling | Enforce request size limits and offload large accepted payloads so inspection stays practical |
| Payload validation | Optional JSON Schema validation and custom JavaScript transforms |
| Platform integrations | Apify web server, Dataset, Key-Value Store, saved runs, API automation, and MCP-friendly Apify workflows |
| Ops endpoints | /health, /ready, /system/metrics, and /info |
Quick start on Apify
1. Start the actor with a minimal config
2. Open the generated runtime info
After the actor starts, open the web server URL and call /info.
3. Send a test webhook
4. Inspect the captured event
processingTime is the server-side processing cost only. It does not include any configured responseDelayMs latency simulation.
Advanced configuration examples
Secure an endpoint and verify a Stripe signature
Forward captured traffic to another system
Mock a slow callback with a custom response
Send alerts to Slack or Discord
Transform payloads with custom scripting
The script runs in a disposable worker isolate and receives { event, req, console, HTTP_STATUS }.
It can normalize, enrich, or redact payload data before the event is stored, but it does not get direct access to process, require, filesystem, or network primitives. String-based code generation such as eval() and Function() is disabled, and the runtime enforces bounded timeout and memory limits. If a script fails or times out, the error is logged and the webhook still completes through the normal response path.
API surface
The actor exposes a small but practical HTTP surface.
/health and /ready are intentionally rate-limited but not protected by authKey, so orchestrators and load balancers can probe them even when management routes require authentication.
During intentional shutdown, the HTTP listener is drained before SyncService and DuckDB teardown begin, so new probe traffic does not race a partially shutting-down read model.
| Endpoint | Purpose |
|---|---|
GET / | Lightweight dashboard page |
GET /info | Runtime info, active webhooks, endpoint discovery |
ANY /webhook/:id | Capture incoming webhook traffic |
GET /logs | Query captured events |
GET /logs/:logId | Fetch one log entry |
GET /logs/:logId/payload | Retrieve the stored payload for an event |
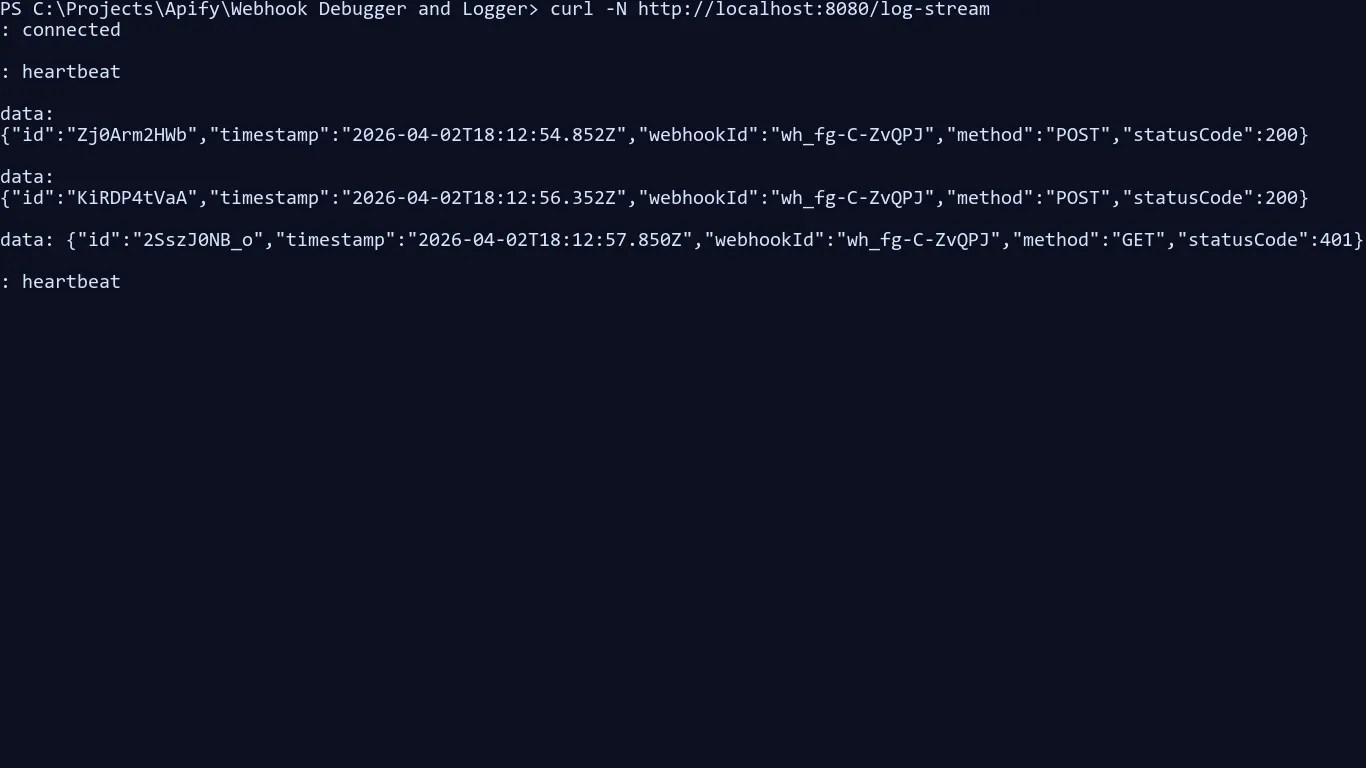
GET /log-stream | SSE live feed of captured events |
POST /replay/:webhookId/:itemId | Replay a captured event to a target URL |
GET /system/metrics | Sync and operational metrics |
GET /health | Liveness probe |
GET /ready | Readiness probe |
For the full contract, see docs/api-reference.md and the machine-readable schema in .actor/web_server_schema.json.
Live stream preview

Platform and MCP workflows
This project is built as an Apify Actor first, not as a standalone one-off webhook bin.
Apify platform integrations
- Run it from the Apify Console or API and get public
runs.apify.netwebhook URLs immediately. - Persist captured events to the Apify Dataset for export, filtering, or downstream automation.
- Persist active webhook state and large-payload offloads in the Apify Key-Value Store.
- Reuse runs in saved tasks, schedules, and other Apify automation flows.
- Expose the web server surface through
.actor/web_server_schema.json, which makes the HTTP contract discoverable and easier to automate. - When you keep the actor warm with Apify Standby mode, the HTTP endpoints stay ready for webhook-style traffic instead of paying a cold-start penalty on each request.
MCP-enabled workflows through Apify
This actor is not itself an MCP server, but it fits cleanly into MCP-enabled automation built around Apify.
- MCP clients can trigger or inspect Apify Actors, runs, datasets, and KVS records through Apify tooling.
- Agent-driven workflows can use this actor as a disposable webhook target while another MCP tool verifies payloads, dashboards, or downstream effects.
- The repo includes MCP-oriented development assets and guidance under the repo rules for using Apify and Chrome DevTools MCP during development.

In practice, that means AI-assisted integration tests can create a run, post webhook traffic, inspect /info or /logs, and then continue through the rest of an Apify or browser automation workflow.
Operational behavior
Hot-reload input configuration
The runtime can apply input changes without a full restart.
- On Apify,
HotReloadManagerpolls the Key-Value Store for updated actor input. - In local development, it watches the generated
storage/key_value_stores/default/INPUT.jsonfile withfs.watch. - Reloadable settings flow through
AppState.applyConfigUpdate(), which updates rate limiters, auth, retention, replay settings, forwarding settings, and parser limits in place. - Set
DISABLE_HOT_RELOAD=trueif you want a fixed configuration for reproducible local runs.
This is useful when you want to tune forwarding, replay, auth, or limits while the actor is already receiving traffic.
Rate limiting
The actor protects both ingress and management endpoints.
rateLimitPerMinutecontrols the main API and management route limiter.- Webhook ingestion also applies a dedicated per-webhook limiter tuned for higher event throughput.
- When limits are exceeded, the runtime returns standard HTTP throttling responses and emits rate-limit metadata in the normal request path.
Use tighter limits for public debugging endpoints and looser limits for high-throughput provider tests.
Retries and timeouts
Retry and timeout behavior exists in several places and serves different goals.
| Setting | What it controls | Default behavior |
|---|---|---|
maxForwardRetries | Retries for outbound forwarding to forwardUrl | Retries transient delivery failures with backoff and circuit breaker protection |
replayMaxRetries | Retries for replay requests | Retries replay delivery attempts before marking them failed |
replayTimeoutMs | Per-attempt replay timeout | Bounds replay requests so a dead downstream does not hang the actor |
responseDelayMs | Artificial response delay after processing | Simulates slow callbacks for client timeout testing without inflating processingTime |
In addition to input-level settings, the runtime has internal bounded timeouts for alert delivery, background tasks, custom script execution, shutdown, DNS resolution, and outbound forwarding.
If you need the detailed implementation model behind these controls, see docs/architecture.md.
Alert notifications
When debugging webhook pipelines, passive logs are often not enough. The actor can push notifications to Slack and Discord so failures surface immediately.
- Slack incoming webhook notifications
- Discord webhook notifications
- Trigger conditions for
error,4xx,5xx,timeout, andsignature_invalid - Works well with forwarding and replay workflows when you need to know that downstream delivery broke
This is especially useful when the actor is running on Apify in standby mode or as a long-lived debugging endpoint.
Custom scripting
The customScript input gives you an inline JavaScript hook for event transformation before storage.
Scripts execute inside a throwaway worker thread that hosts an isolated vm context. Only the mutable event object, a safe copy of req, console, and HTTP_STATUS are injected into that context.
Use it to:
- normalize payload shapes from different providers
- parse JSON bodies and inject debug metadata
- strip or remap fields before persisting
- mark events for downstream routing or replay decisions
Because the script receives both event and req, you can combine payload, header, and query information when preparing the stored record.
Guardrails:
reqis a copied, reduced request snapshot rather than the live Express request object.process,require, filesystem, and network APIs are not exposed to the script.eval()andFunction()style code generation are disabled inside the isolate.- Timeouts and worker resource limits stop runaway scripts without blocking the main request handler.
- Operators can raise only the worker heap ceilings via
CUSTOM_SCRIPT_WORKER_MAX_OLD_GENERATION_MB(clamped to 16-256 MB, default 32) andCUSTOM_SCRIPT_WORKER_MAX_YOUNG_GENERATION_MB(clamped to 8-128 MB, default 16) when legitimate scripts need more headroom. - Script failures are logged, and the capture pipeline falls back to the actor's normal response flow.
Architecture at a glance
The runtime uses a CQRS-style split:
- Write model: Apify Dataset stores captured events as the durable source of truth.
- Read model: DuckDB mirrors event metadata as a disposable local query layer for fast filtering and retrieval on
/logs. - State store: Apify Key-Value Store keeps active webhook state, large payload offloads, and other runtime state.
That design lets the actor keep ingesting even if DuckDB needs to rebuild from the Dataset.
DuckDB reset coordination is restart-safe as well: new DB callers wait behind a reset gate, while already-queued serialized writes and transactions are allowed to drain before the singleton is torn down. That avoids deadlocks during test restarts and lifecycle rebuilds without weakening write serialization.
For deeper implementation detail, see docs/architecture.md.
Self-hosting
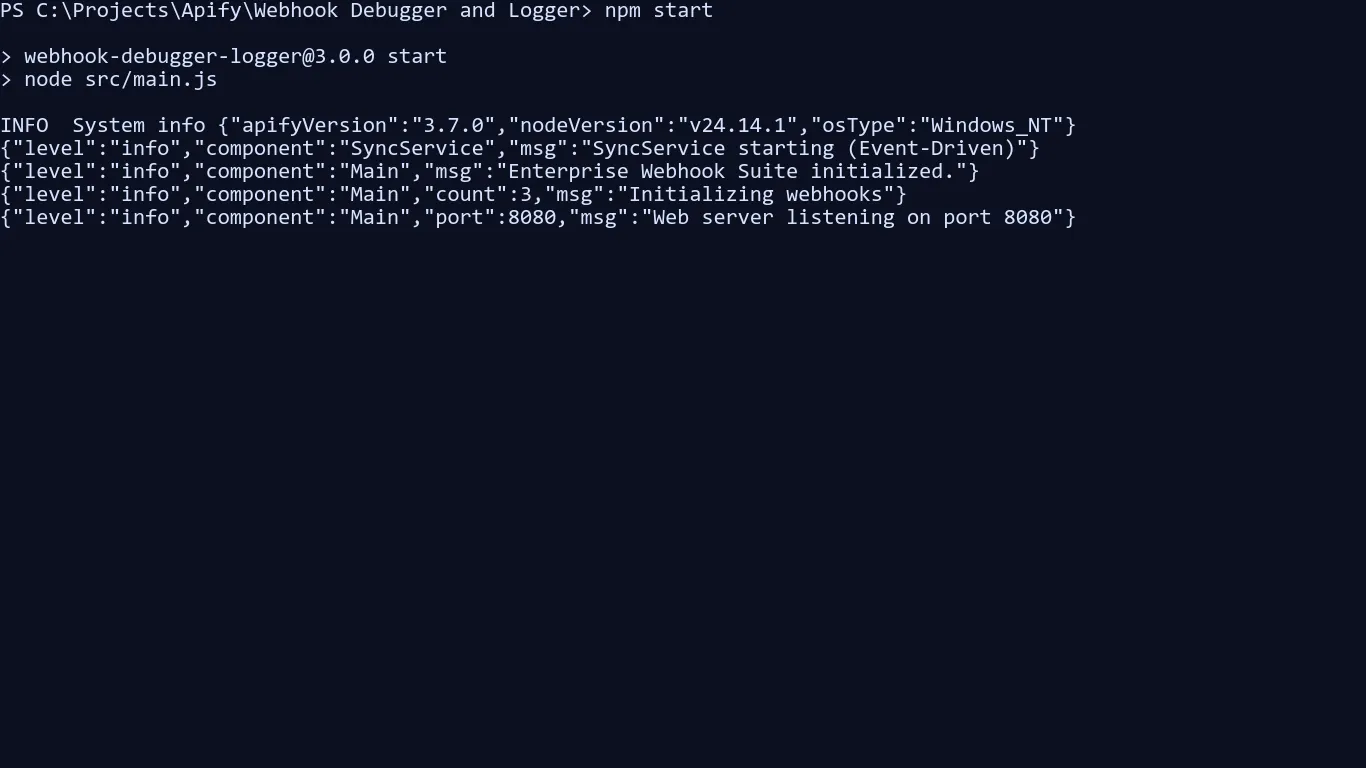
Run directly with Node.js
The web server listens on http://localhost:8080 by default.
CLI demo screenshots
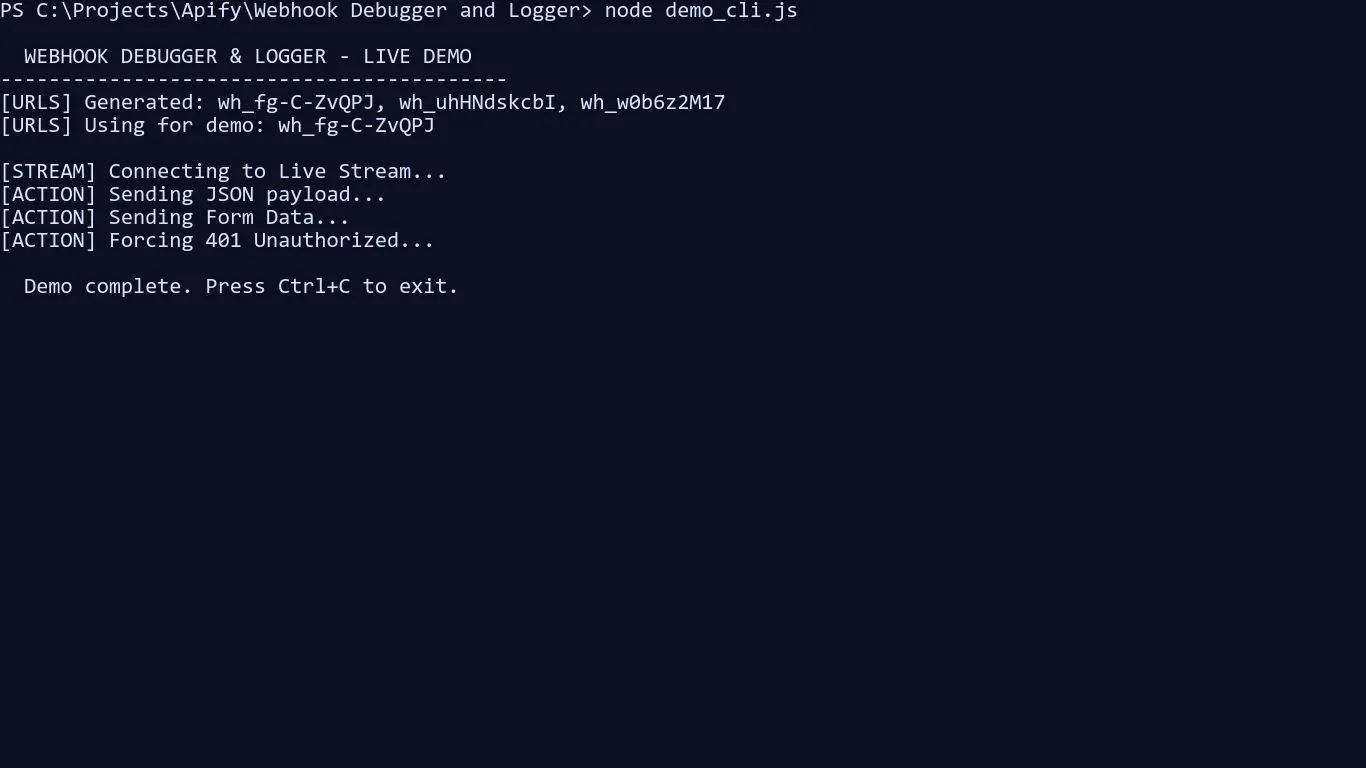
Local .env loading and override order
For local CLI and self-hosted runs, the app automatically loads a .env file from the current working directory.
- Existing process environment variables win over
.envvalues. .envloading is skipped during Jest runs so tests stay deterministic.- The main entrypoint imports the loader explicitly, and the shared env helper also imports it so env-backed constants still resolve correctly in modules that are evaluated outside
src/main.js.
Use .env.example as the starting point for local configuration.
Typical local overrides:
Useful environment variables:
| Variable | Purpose |
|---|---|
ACTOR_WEB_SERVER_PORT | Local HTTP port override |
INPUT | Full actor input JSON for local or container boot |
AUTH_KEY | Used by demo_cli.js when calling protected endpoints |
DEMO_TARGET | Used by demo_cli.js to select a local target (localhost, ipv4, ipv6) |
APIFY_LOCAL_STORAGE_DIR | Local storage location for state, datasets, and offloaded payloads |
DUCKDB_STORAGE_DIR / DUCKDB_FILENAME | Override DuckDB storage location and file name |
Run with Docker
There is also a dedicated standalone image target in Dockerfile via --target runtime-standalone. For a fuller local validation flow, including SSE verification, see docs/local_docker_testing.md.
Pricing
This actor is configured for Apify pay-per-event pricing.
At the time of writing, the Apify Store listing advertises:
- $10 / 1,000 captured webhooks
Examples:
- 100 captured webhooks: about $1
- 1,000 captured webhooks: about $10
- 10,000 captured webhooks: about $100
[!NOTE] Always check the live Apify Store listing for the current price before running large test campaigns.
Support the project
If Webhook Debugger, Logger & API Mocking Suite saves you time, helps you debug a painful integration, or gives your team a better self-hosted workflow, you can help support its development.
Sponsor / support
Need hands-on help?
If you want help debugging or stabilizing a webhook integration, I also offer direct implementation support for setups such as:
- Stripe webhooks
- GitHub webhooks
- Shopify webhooks
- Slack events and callback flows
- self-hosted Docker deployments
- signature verification and replay workflows
If that would help, open an issue or reach out through one of the support links above and mention your use case.
Why support it?
Support helps fund:
- maintenance and bug fixes
- new provider integrations
- better deployment and self-hosting guides
- premium webhook recipes and debugging playbooks
- faster iteration based on real user feedback
Typical use cases
- Inspect webhook payloads from Stripe, Shopify, GitHub, Slack, or custom services.
- Validate that your application handles success, delay, 4xx, and 5xx callback scenarios.
- Replay captured payloads against staging after fixing a bug.
- Forward test traffic into another service while still keeping a full audit trail.
- Run temporary or self-hosted debug endpoints for QA, integration, or support teams.
Playbooks
The repo includes focused operational guides for common debugging and rollout scenarios:
- Zapier, Make, and n8n bridge
- GitHub App and CI webhook debugging
- Incident response and replay recovery
- Large payload and binary forensics
- PII-safe production capture
- Custom HMAC partner integrations
- Callback sandbox prototyping
- Canary validation and shadow replay
Frequently asked questions
How long do generated webhook URLs stay active?
Set retentionHours anywhere from 1 to 168 hours. Expired webhooks immediately stop accepting traffic. Their logs are purged from the /logs query endpoint during the next cleanup cycle (roughly every 10 minutes). Reducing retentionHours via hot-reload only affects newly generated webhooks — pre-existing webhooks keep their original, longer expiry window. Events already written to the Apify Dataset are retained independently of this setting.
Can I secure my webhook endpoints?
Yes. You can combine authKey, allowedIps, signature verification, and masked header logging.
Does it support replaying captured traffic?
Yes. Use the replay endpoint to send a stored event to another target URL.
Can I use it as a mock callback server?
Yes. You can return custom status codes, bodies, headers, and artificial latency to simulate downstream behavior.
Where are logs stored?
Captured events are written to the Apify Dataset as the durable source of truth. DuckDB keeps a disposable read model for fast log queries, and the Apify Key-Value Store holds active webhook state plus large payload offloads.
What happens with large payloads?
The actor enforces maxPayloadSize and rejects requests that exceed the configured hard limit. For large payloads that are still within the accepted range, the runtime can offload the payload content to the Apify Key-Value Store so the event remains queryable without forcing every large body through the in-memory read model.
Can I run it outside Apify?
Yes. You can run it locally with Node.js or Docker, or deploy the container into your own environment.
Documentation and related resources
- API reference
- Architecture overview
- Local Docker testing guide
- Manual demo guide
- Publication guide
- Security policy
If you are looking for implementation and marketing guidance used during development, see the materials under docs/marketing.