

World Bank Scraper: 16,000 Development Indicators
Pricing
from $0.37 / 1,000 indicator scrapeds
World Bank Scraper: 16,000 Development Indicators
Scrape World Bank open data: any of 16,000+ indicators across 200+ countries and 60 years. GDP, inflation, population, energy, health and education series. No key.
Pricing
from $0.37 / 1,000 indicator scrapeds
Rating
0.0
(0)
Developer

Arman Hossain
Maintained by CommunityActor stats
0
Bookmarked
1
Total users
0
Monthly active users
17 days ago
Last modified
Categories
Share
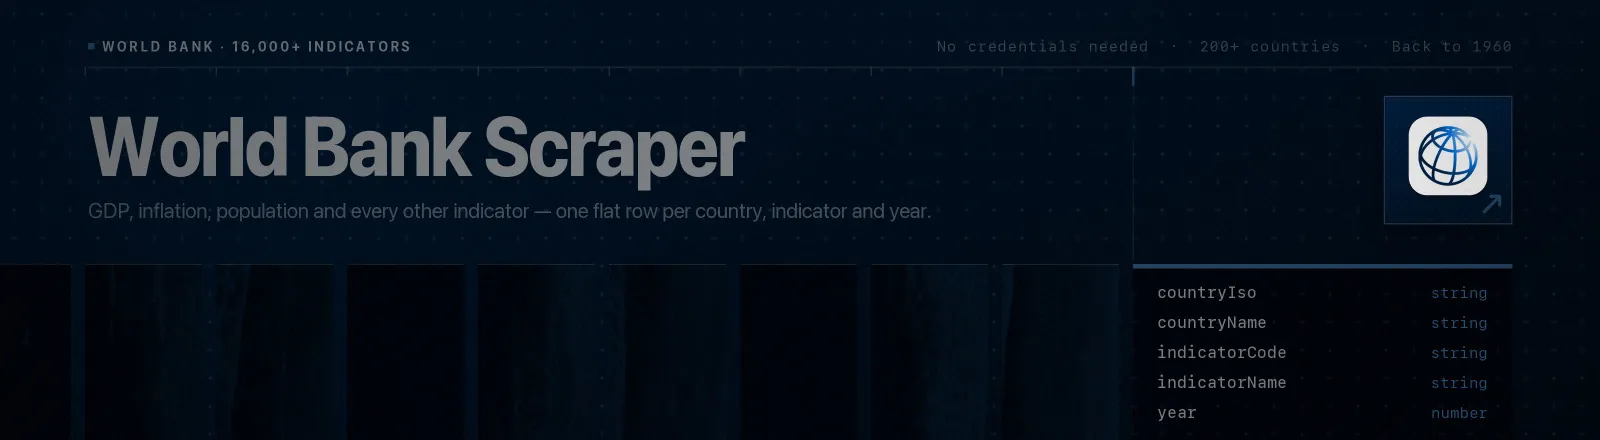
World Bank Scraper exports any of the World Bank's 16,000+ development indicators, GDP, inflation, population, trade, energy, health, education, for 200+ countries and every aggregate, back to 1960, as one flat row per country-indicator-year.
It reads the public World Bank Indicators API directly: no proxy setup, no browser, no credentials to manage. A single request returns up to 20,000 observations, so a full indicator across every country and every year is usually one round trip.
Agent skill: SKILL.md
What you get
| Output field | Meaning |
|---|---|
countryIso | ISO-3 code (USA), falling back to ISO-2 on the handful of aggregate rows that lack one |
countryName | Country or aggregate name as the World Bank publishes it |
indicatorCode, indicatorName | e.g. NY.GDP.MKTP.CD and GDP (current US$) |
year | Observation year, as a number |
value | The observation, null where the World Bank has no data |
unit | Unit string when the series carries one |
region | World Bank region, joined from the country reference table, Aggregates for non-country rows |
incomeLevel | Income classification, e.g. Lower middle income |
decimalPlaces | Publisher's suggested display precision |
scrapedAt | Run timestamp |
A RUN_SUMMARY record in the key-value store holds per-run counts, the filters used, and any indicator that failed.
Common use cases
- Macro research and country risk scoring. Pull GDP, inflation and debt for a watchlist in one run.
- Market sizing. Population and GDP per capita by country, joined to your own segmentation.
- Economics dashboards. A scheduled refresh keeps a time-series store current without any key management.
- Development and ESG analysis. Energy, emissions, health and education series with region and income level already attached.
- Data journalism. Reproducible extracts with the indicator code recorded on every row.
Quick start
GDP and population for three economies:
Every country, one indicator, this century:
A complete gap-marked grid for a single country, for time-series work that needs the missing years present:
Input
| Field | Type | Default | Notes |
|---|---|---|---|
indicators | array | - | Required. Indicator codes, or full data.worldbank.org/indicator/. URLs. |
countries | array | all | ISO-2 or ISO-3 codes. Aggregates (EMU, WLD, SAS) work. Empty or all returns everything. |
fromYear | integer | - | Earliest year. Most series start in 1960. |
toYear | integer | - | Latest year. Defaults to the most recent published. |
skipNullValues | boolean | true | Drop country-years with no observation. Turn off to keep the full grid. |
maxResults | integer | 0 | Cap on total records. 0 = no limit. |
Setting only fromYear or only toYear is fine, the other end of the range is filled in with 1960 or the current year. Passing all alongside specific countries makes all win, because the source treats them as mutually exclusive.
Finding an indicator code
Open the indicator on data.worldbank.org and read the code out of the URL:
| URL you see | Code |
|---|---|
data.worldbank.org/indicator/NY.GDP.MKTP.CD | NY.GDP.MKTP.CD |
data.worldbank.org/indicator/SP.POP.TOTL | SP.POP.TOTL |
data.worldbank.org/indicator/FP.CPI.TOTL.ZG | FP.CPI.TOTL.ZG |
You can paste the whole URL, the Actor extracts the code itself.
Output example
API example
JavaScript example
Notes
- The response is
[metadata, rows], not an object. Every World Bank response is a two-element array. This Actor handles it explicitly. It is the single most common way naive parsers break on this API. - Bad codes come back as HTTP 200. An unknown country or indicator returns
[{ "message": [.] }]with a success status, so the body is inspected rather than the status code. Those indicators land inRUN_SUMMARY.failureswith the API's own message. regionandincomeLevelare joined, not returned. The indicator endpoint does not carry them; the/countryreference table is fetched once per run and joined on ISO code. If that lookup fails the run continues with both fieldsnull.unitis almost always empty. The World Bank ships the unit insideindicatorName(GDP (current US$)) rather than in theunitfield. It is preserved for the rare series that populate it.- Null values are dropped by default. The API emits a row per country-year regardless of whether an observation exists;
skipNullValues: falsekeeps them if you need a dense grid. - Aggregates are included when you ask for
all. Rows likeAFE(Africa Eastern and Southern),EMU(euro area) orWLD(World) are aggregates, not countries, 78 of the 295 entries. They are marked withregion: "Aggregates"andincomeLevel: "Aggregates", soregion !== "Aggregates"gives you sovereign states only. - Transient errors are retried. 429, 5xx and network errors get four attempts with exponential backoff (0.5 s → 1 s → 2 s). A rejected code fails immediately rather than burning retries.
- Public data only. No authentication, no personal data, no access-control bypass.
FAQ
Do I need a proxy? No. Proxy configuration is not required to run this Actor.
Do I need an account on the source? No, and there is no credentials to manage.
What happens if one indicator is unavailable? It is reported in RUN_SUMMARY.failures and the run continues with the rest. The Actor only errors out if every indicator failed.
Can I schedule it? Yes, it is designed for scheduled runs. The World Bank republishes on a slow cadence, so weekly or monthly is usually enough.
How many indicators can I pass at once? There is no hard cap. Each indicator is one request per 20,000 rows, so dozens per run is normal.
Why is the most recent year missing for some countries? The World Bank publishes on a lag that varies by country and series. That is the source's cadence, not a scraping gap.
How do I exclude regional aggregates? Drop rows where region is "Aggregates". The World Bank marks all 78 aggregate entities that way in both region and incomeLevel.
Can I integrate it with something else? Yes, Apify API, client libraries, webhooks, scheduled runs, dataset exports (JSON/CSV/Excel) or MCP. Output is structured JSON.


