

Google Trends Scraper — Rising Searches & Breakouts
Pricing
from $25.00 / 1,000 trend results
Google Trends Scraper — Rising Searches & Breakouts
Track search demand on Google Trends: interest over time, interest by region, and the rising related searches Google flags as Breakout. Compare up to 5 terms on one scale, or list what a country is searching right now. No login, no API key.
Pricing
from $25.00 / 1,000 trend results
Rating
0.0
(0)
Developer

Yuliia Kulakova
Maintained by CommunityActor stats
0
Bookmarked
2
Total users
1
Monthly active users
a month ago
Last modified
Categories
Share
Google Trends Scraper — Rising Searches, Regions & Breakouts
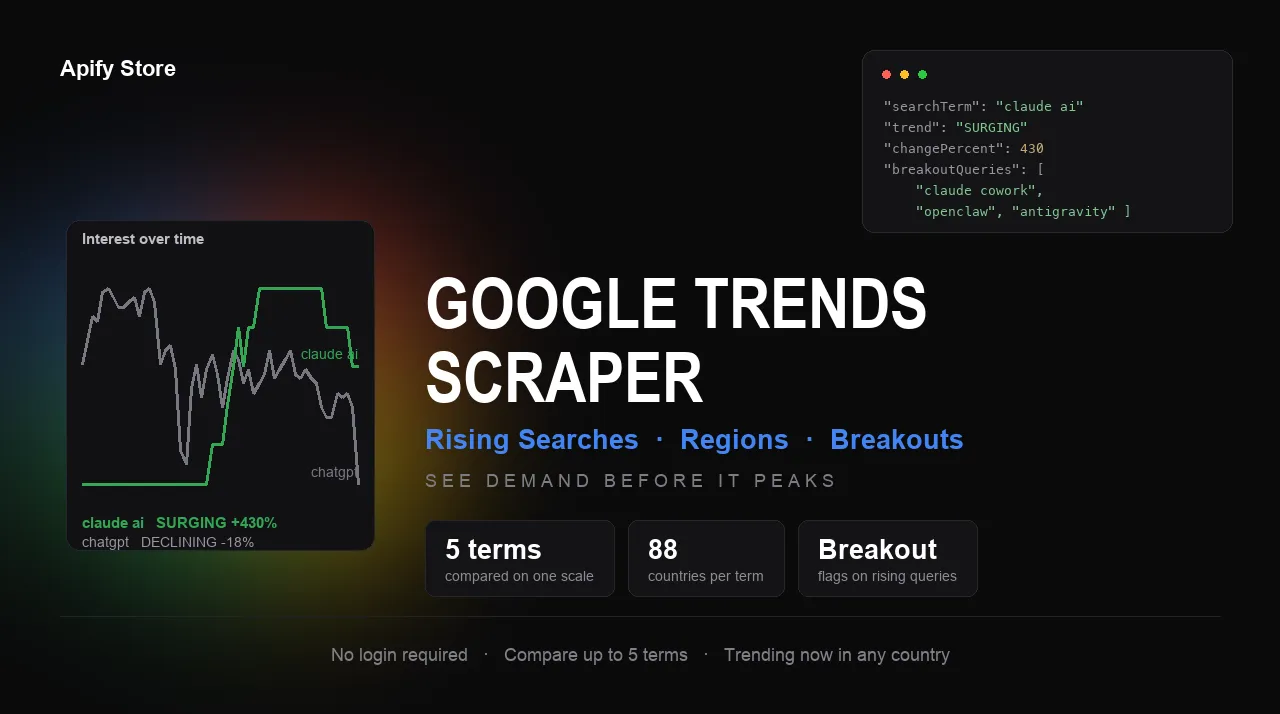
Find out whether demand for something is growing or dying — and what people are searching instead.
No Google account, no API key. Google Trends has no official public API; this reads the same data the site does.
What makes this different
Most Google Trends scrapers hand you the interest curve and stop there. The curve tells you what happened. The rising searches tell you what happens next — and nobody else on the Store returns them.
| Typical scraper | This scraper | |
|---|---|---|
| Interest over time | ✓ | ✓ |
| Interest by region | ✓ | ✓ |
| Related searches (top) | — | ✓ |
| Rising searches + Breakout flags | — | ✓ |
| Compare up to 5 terms on one scale | one term at a time | ✓ |
| Trend direction, computed | — | ✓ |
The Breakout signal
Google marks a related search as Breakout when it grows faster than a percentage can express — typically a term that barely existed weeks ago. It is the earliest demand signal Trends offers, and it comes free with every term you analyse.
A real result from testing claude ai:
Three product names that were nothing a month earlier. That is what you are buying.
Direction, not just numbers
Every term is classified so you can filter and sort without doing the maths:
| Label | Meaning |
|---|---|
SURGING | +50% or more |
RISING | +15% to +50% |
STABLE | within ±15% |
DECLINING | −15% to −50% |
COLLAPSING | −50% or worse |
Comparison is against the same window a year apart, ignoring the in-progress bucket that always reads as a dip.
trendConfidence tells you whether to believe the percentage. Google rounds its index to whole numbers, so a term averaging 2 out of 100 moves in 50% steps by definition — testing reebok returned "SURGING +54%" off an average interest of 2, which is rounding noise, not demand. Read HIGH (average ≥15) as trustworthy, MEDIUM (5–14) as directional, and LOW (under 5) as too small to call.
Quick start
That is the whole input. Terms share one 0-100 scale, exactly like the comparison view on Google Trends.
What you get
An unedited record, trimmed for length:
Measured coverage over 12 months: 54 data points, 80–88 regions, 13–25 top and 5–25 rising related searches per term.
Two modes
Analyse search terms
Up to five terms are charted together on one scale. Pass more and they are split into batches of five — values stay comparable inside a batch, not across batches, and the log says so.
Set compareTerms: false to measure each term on its own scale instead. Use that when terms are unrelated, otherwise a big term flattens a small one to near-zero.
Trending right now
Returns what a country is searching today, with approximate traffic and the news stories driving it.
Inputs worth knowing
| Input | Why it matters |
|---|---|
timeframe | Shorter ranges give finer data: hours return minute-level points, a year returns weekly |
customTimeframe | Exact window, e.g. "2026-01-01 2026-06-30" |
geo | US, DE, or a sub-region like US-CA for California. Empty = Worldwide |
category | Disambiguates a word — jaguar in Autos is a different search from jaguar in Pets |
includeSuggestions | Google's own autocomplete topics; helps tell the company from the animal |
Turning off includeRegions or includeRelatedQueries makes runs noticeably faster when you only need the curve.
Use cases
- SEO and content — find rising searches before they are competitive, and see which existing terms are decaying.
- Product and market research — compare demand for competing products, features or brands on one scale.
- Market entry —
interestByRegionshows where demand actually sits before you commit spend. - Trend spotting — breakout queries surface product names and topics weeks before they show up in the news.
- Seasonality planning — five years of history reveals when demand peaks each year.
- Newsrooms — trending mode gives what a country is searching right now, with source articles.
Honest limitations
These come from Google Trends itself, not from the scraper.
Values are relative, never absolute. 100 means "the highest point in this query", not a search volume. Trends never publishes real counts — anyone claiming to give you them is estimating.
Low-volume terms return nothing. Google withholds data below a traffic threshold. The record still comes back with the term and settings, all data fields empty — a nonsense term in testing returned exactly that. Try a broader term, a longer timeframe, or Worldwide instead of one country.
Comparison changes the numbers. With compareTerms: true, a term that is small next to a giant will read near zero — that is the point of a shared scale, not an error. Turn comparison off to measure it alone.
The latest bucket is incomplete. The current week or day is still filling and always looks like a drop. Those points are marked isPartial: true and excluded from the trend calculation.
Trending news varies by country. The US feed carries source articles and images; some countries return the trending terms only. Nothing to be done about it from this side.
Related searches need volume. Terms with thin traffic often return an empty rising list.
Google rate-limits, and a single section can be lost. Runs rotate connections and retry, but occasionally one widget still fails while the rest succeed. When that happens the affected record carries incompleteSections (e.g. ["relatedQueries"]) and the log says which term was hit — rather than silently returning a record that looks complete. Re-run to fill the gap.
FAQ
Do I need a Google account or API key? No. Nothing to configure.
Are proxies included? Yes, automatically. Leave the Proxy field empty.
How fast is it? Two terms with everything enabled: about 15 seconds. Seven terms: under three minutes. Trending: under 20 seconds.
Can I get actual search volumes? No — and neither can anyone else. Google Trends publishes a 0-100 relative index only.
Why is my term all zeros?
Either it is below Google's volume threshold, or it is being compared against a much larger term. Try compareTerms: false.
Can I track a term over time?
Schedule the actor. Each run stamps scrapedAt, so successive runs build a history Google itself does not keep.
Which countries work?
All of them, plus sub-regions like US-CA or GB-ENG.
Maintained by brilliant_gum. Issues and feature requests welcome on the Issues tab.


