

NASA POWER Weather & Solar Data: Coordinates Export
Pricing
from $0.21 / 1,000 data points
NASA POWER Weather & Solar Data: Coordinates Export
Get daily or monthly NASA POWER weather and solar data for up to 10 latitude/longitude points: temperature, precipitation, wind, solar irradiance and more. One row per location, period and parameter with units; missing values are null and free.
Pricing
from $0.21 / 1,000 data points
Rating
0.0
(0)
Developer

Cliqto Media
Maintained by CommunityActor stats
0
Bookmarked
2
Total users
1
Monthly active users
5 days ago
Last modified
Categories
Security
Limited permissionsShare
Get historical daily or monthly weather and solar data for any latitude and longitude from NASA POWER: air temperature, precipitation, wind, humidity, solar irradiance and other parameters since 1981. You get one clean row per location, period and parameter, with units, and missing values as null.
It is for analysts, developers and AI agents in agriculture, solar energy, buildings and data science. The smallest run is one point and the default four parameters for the last 30 days: it takes a few seconds and no API key. A typical run (2 points, 4 parameters, 30 days, 212 values) costs about $0.065 on the Free plan.
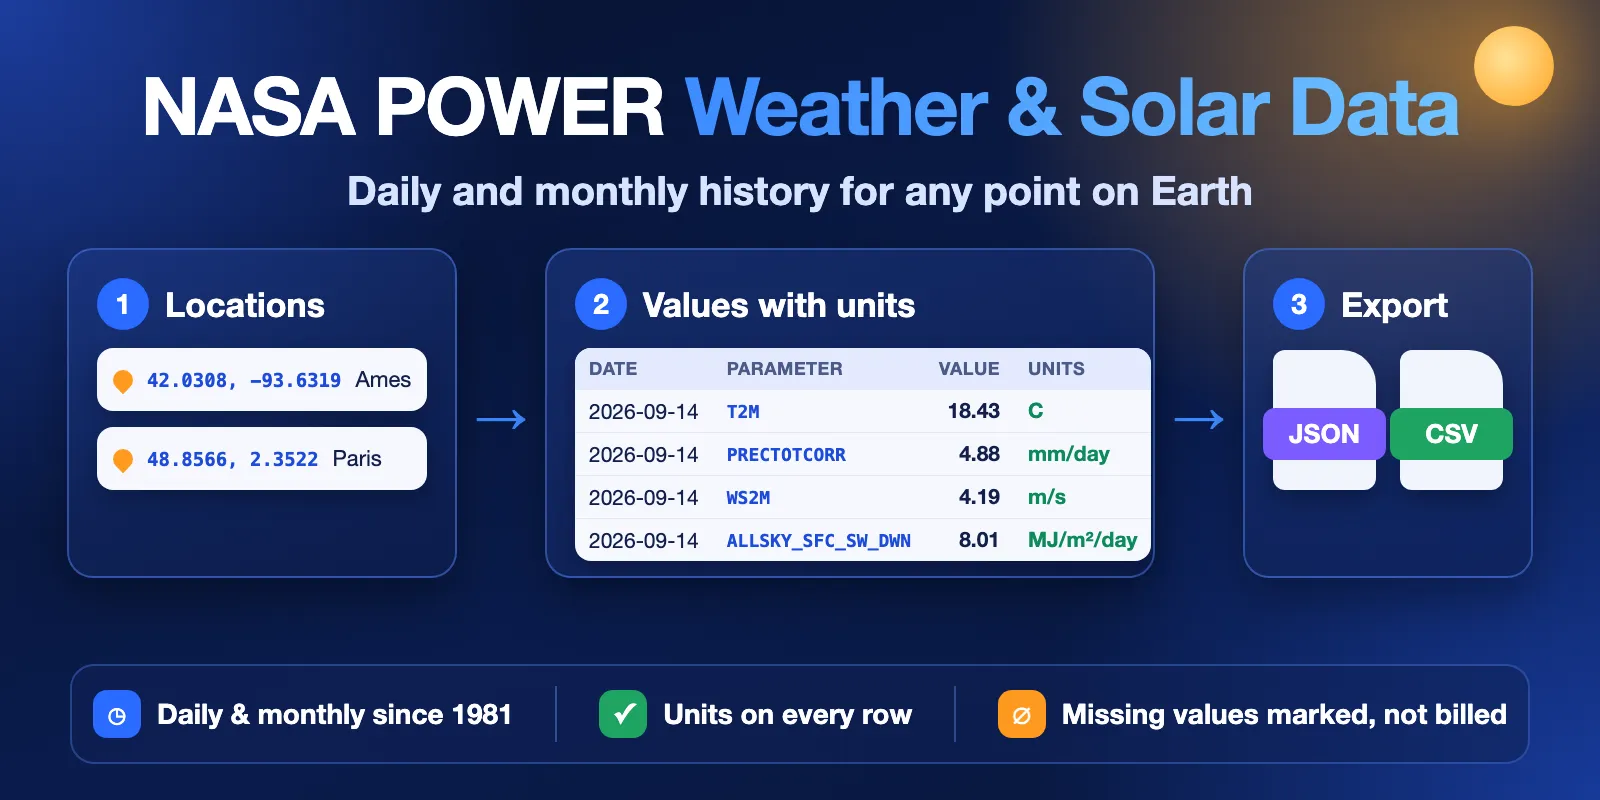
Table of contents
- What it does
- Quick start
- Input
- Input examples
- Output
- Output fields
- Pricing
- Use cases
- Schedules and monitoring
- API, MCP and integrations
- Limits and partial results
- Troubleshooting
- FAQ
- Source and attribution
- Support
What it does
NASA POWER is a free NASA service with global weather and solar data on a grid of about 0.5° (about 50 km). It is made from satellite data and climate models (MERRA-2, GEOS-IT, CERES, FLASHFlux), not from local weather stations.
This Actor:
- Takes up to 10 points as
latitude, longitude. - Calls the official NASA POWER API once per point (up to 20 parameters per call).
- Turns the answer into long rows: location × period × parameter → value + units.
- Marks NASA's fill value
-999asstatus: "missing"andvalue: null. Missing rows are free. - Saves a run summary with counts, units and the NASA attribution text.
Good fit
- Daily weather history for fields, farms or sites (temperature, rain, wind, humidity).
- Solar irradiance history for solar site checks, in MJ/m²/day, kWh/m²/day or W/m².
- Monthly and annual values since 1981 for long-term comparisons and model features.
- One table you can load into Excel, pandas, BigQuery or an AI agent without parsing NASA's JSON.
Not a fit
- No forecasts. NASA POWER is history plus near-real-time. A future end date is moved back to today.
- No hourly data, climatology or regional grids in this version. Only daily and monthly point data.
- Not station data. Values are grid-cell averages; points close together can return the same cell.
- The newest 2–5 days are usually not published yet. They come back as
missing.
Quick start
- Open the Input tab. Two points (Ames, Iowa and Paris) and four parameters are already filled in.
- Keep Resolution =
Dailyand Last N days =30, or change them. - Click Start.
- Open the Output tab and look at the Values view.
Expected result: about 240 rows in a few seconds, for example Ames IA | 2026-09-13 | T2M | 16.54 | C. About 28 of them are the newest days, which have status: "missing" and are not charged.
Input
| Field | Type | Default | Allowed values | What it changes |
|---|---|---|---|---|
locations | list of text | — (prefill: 2 points) | 1–10 lines, "lat, lon" or "lat, lon, label"; lat −90..90, lon −180..180 | Points to fetch. Invalid lines become error rows. Repeats (same 4 decimals) are skipped. Required. |
parameters | list of text | T2M, PRECTOTCORR, WS2M, ALLSKY_SFC_SW_DWN | 1–20 NASA POWER codes | What to measure. Unknown codes are dropped with a warning. |
temporal | daily or monthly | daily | — | daily: one value per day, up to 366 days. monthly: one value per month for whole years, plus an annual value. |
community | AG, RE or SB | AG | — | Units. Solar: AG = MJ/m²/day (units: MJ/m^2/day), RE = kWh/m²/day (kW-hr/m^2/day), SB = W/m² (W m-2). Temperature, rain and wind are the same. |
lastDays | integer | 30 | 1–366 | Range length when startDate is empty. |
startDate | date | empty | from 1981-01-01 | First day. Monthly runs use the whole year of this date. |
endDate | date | today | not before startDate | Last day, inclusive. A future date becomes today. |
timeStandard | LST or UTC | LST | daily only | Day boundary: local solar time (NASA default) or UTC. |
includeMissingValues | boolean | true | — | Keep free missing rows. Turn off to get only real values. |
includeAnnual | boolean | true | monthly only | Add the annual value per year (period: "2025", isAnnual: true). |
Tips:
- Popular codes:
T2M(air temperature at 2 m),T2M_MAX,T2M_MIN,PRECTOTCORR(precipitation),RH2M(relative humidity),WS2M(wind speed at 2 m),ALLSKY_SFC_SW_DWN(solar irradiance),CLRSKY_SFC_SW_DWN(clear-sky irradiance). - For more than one year of history, use
monthly. One monthly run can cover 1981 to last year. - Choose
REif you work with solar panels and want kWh/m²/day.
Input examples
Last 30 days, two farms (this is the prefill):
Monthly solar history for a solar site, 2015–2025, in kWh/m²/day:
One full year of daily highs and lows, only real values:
Output
The default Dataset has one row per location, period and parameter. The Values view shows status, location, period, parameter, value, units, parameter name, community and status reason. Download it as JSON, CSV, Excel or XML.
A real complete row:
A missing row has the same fields with "value": null and a reason, for example "NASA POWER has no value for this period yet (fill value -999) or the source does not cover it".
If a parameter has no value at all in the whole range, you get one missing row for it with period: null, not one empty row per day. If no parameter has any value, you get one missing row per location with parameter: null.
The key-value store record RUN_SUMMARY has the run status, counts (rows, valueRows, missingRows, errorRows, chargedDataPoints), units per parameter, warnings, request statistics and the NASA attribution text.
Output fields
| Field | Type | Can be null | Example | Meaning |
|---|---|---|---|---|
status | text | no | complete | complete (has a value, charged), missing (no value yet, free), error (point not fetched or invalid, free). |
statusReason | text | yes | null | Why the row is missing or error. |
locationIndex | integer | no | 1 | Position of the point in your input list. |
locationLabel | text | yes | Ames IA | Your label, if you gave one. |
latitude, longitude | number | yes (invalid input) | 42.0308 | The point as you sent it. |
elevationM | number | yes | 310.22 | Elevation of the NASA grid cell, in metres. |
temporal | text | no | daily | daily or monthly. |
period | text | yes | 2026-09-13, 2025-03, 2025 | Day, month or year (annual value). |
date | text | yes | 2026-09-13 | ISO date; for months, the first day of the month; null for annual values. |
year, month, day | integer | yes | 2026, 9, 13 | Parts of the period. |
isAnnual | boolean | no | false | true for the annual value of a monthly run. |
parameter | text | yes | T2M | NASA POWER code. |
parameterName | text | yes | Temperature at 2 Meters | NASA's long name. |
value | number | yes | 16.54 | The value. null when NASA returns -999. |
units | text | yes | C | Units from NASA POWER for this community. Never converted. |
community | text | no | AG | AG, RE or SB. |
timeStandard | text | no | LST | Day boundary used. |
provider | text | no | NASA POWER | Data source. |
apiVersion | text | yes | v2.10.0 | NASA POWER API version that answered. |
dataSources | list | no | ["FLASHFLUX","GEOSIT","POWER"] | Upstream data sets NASA POWER used. |
sourceUrl | text | yes | https://power.larc.nasa.gov/api/... | The exact API request, so you can repeat it. |
fetchedAt | text | no | 2026-10-12T13:15:29.789Z | When the row was fetched (UTC). |
Pricing
Pay per event:
| Event | Price |
|---|---|
| Actor start | $0.0015 per run (256 MB memory = one event) |
Data point (one complete row) | $0.0003 (Free plan), $0.000285 (Bronze), $0.00027 (Silver), $0.000255 (Gold and higher) |
missing and error rows are never charged. The Actor start event is charged once per run, also when the run ends with INVALID_INPUT.
Examples on the Free plan:
| Data points | Example | Price |
|---|---|---|
| 10 | 1 point × 1 parameter × 10 days | $0.0015 + $0.003 = $0.0045 |
| 100 | 1 point × 4 parameters × 25 days | $0.0015 + $0.03 = $0.0315 |
| 1,000 | 2 points × 4 parameters × 125 days | $0.0015 + $0.30 = $0.3015 |
| 212 | the prefill run (2 points, 4 parameters, 30 days) | about $0.065 |
The largest daily run (10 points × 20 parameters × 366 days) has up to 73,200 values; we tested 73,000 values (365 days) and 117,000 monthly values (1981–2025) in one run. Set Maximum cost per run in Run options if you want a hard limit: the Actor stops when it is reached and the status is CAPPED.
Use cases
- Agriculture: daily temperature, rain and solar radiation for crop models, growing degree days and irrigation checks.
- Solar energy: monthly irradiance history (kWh/m²/day) to compare sites before a project.
- Buildings and energy audits: monthly temperature and irradiance (W/m²) for a building location.
- Insurance and risk: check what the weather was at a place on a given date range.
- Data science and AI: weather features in one long table, with units in every row.
Schedules and monitoring
You can run the Actor on a schedule, for example every Monday with lastDays: 14, to add new days to your table. NASA POWER updates with a delay of 2–5 days, so recent days may first come as missing and become complete in a later run. Each run returns the full range; it does not show only changes.
API, MCP and integrations
Run it from code with the Apify API or a client library. Example with curl:
Use with AI agents (MCP)
Add this Actor as a tool in any MCP client (Claude, Cursor, VS Code and others) with the Apify MCP server:
An agent can then ask, for example: "Get daily rain and temperature for 42.03, -93.63 for September 2026." The input fields above are the tool's arguments; each row has units and status, so the agent does not need to guess. Key output fields: period, parameter, value, units, status. A typical call (2 points, 4 parameters, 30 days) takes a few seconds and costs about $0.065.
You can also connect results to Google Sheets, Make, Zapier, n8n or webhooks with Apify integrations.
Limits and partial results
- Up to 10 locations and 20 parameters per run.
- Daily: up to 366 days per run. Monthly: whole calendar years from 1981; the current year has only the months NASA POWER has already published.
- Some solar parameters start in 1984, so older months come back as
missing. - The Actor sends at most 3 requests at a time to NASA POWER and retries short errors (HTTP 429 and 5xx).
- If some points fail and others work, the run status is
PARTIAL: good rows are kept, failed points get oneerrorrow each. - Run statuses in
RUN_SUMMARY.status:COMPLETE,PARTIAL,NO_DATA,CAPPED,ERROR,INVALID_INPUT,CANCELLED.
Troubleshooting
| What you see | Why | What to do |
|---|---|---|
Status NO_DATA, rows with value: null | NASA has not published these days yet, or the parameter has no data for that period | Use an earlier end date (5+ days ago) or another parameter. |
| Warning "Skipped parameter(s) not available for community …" | The code does not exist for this community or resolution | Check the code on the parameters page. |
INVALID_INPUT: Daily range is limited to 366 days | Daily range is too long | Split the range, or use temporal: "monthly". |
error row for one location | Bad coordinates or NASA rejected the request | Read statusReason; fix the line. Other points are not affected. |
| Two points give the same values | They are in the same 0.5° grid cell | This is expected for NASA POWER. |
Status ERROR, "Source unavailable" | NASA POWER is down or slow | Try again later. |
FAQ
Do I need a NASA API key? No. NASA POWER is open and needs no key.
Is this real measured weather? It is modelled and satellite-based data for a grid cell, not one station. It is widely used for agriculture and solar studies.
Why is the value null? NASA POWER uses -999 for "no value". We turn it into null and status: "missing", and we do not charge for it.
Can I get the data in wide format (one column per parameter)? The output is long format. In Excel or pandas, pivot by parameter.
Which units do I get? Exactly the units NASA POWER gives for your community. They are in the units field of every row and in RUN_SUMMARY.parameters.units.
Is this an official NASA product? No. This Actor uses the public NASA POWER API and is not affiliated with or endorsed by NASA.
Source and attribution
Data: NASA POWER API v2.10.0, referencing guide. When you use the data, please cite it like this (also in RUN_SUMMARY.source):
The data was obtained from National Aeronautics and Space Administration (NASA) Langley Research Center's Prediction Of Worldwide Energy Resources (POWER) project funded through the NASA Earth Science Division.
Add the version and date from RUN_SUMMARY.source.dataReference, for example "The data was obtained from the POWER Project's Daily 2.10.0 version on 2026/10/12."
Support
Found a problem or need a new parameter or mode? Open an issue in the Issues tab of this Actor. Please add the run ID and your input (without private data).


