
USGS Earthquake Events: Data Export & Change Monitor
Pricing
from $0.63 / 1,000 earthquake events
USGS Earthquake Events: Data Export & Change Monitor
Export earthquakes from the official USGS catalog by time, area (rectangle across the date line or circle), magnitude and depth, with PAGER alert, tsunami flag and felt reports. Monitor new, revised and deleted events between runs.
Pricing
from $0.63 / 1,000 earthquake events
Rating
0.0
(0)
Developer

Cliqto Media
Maintained by CommunityActor stats
0
Bookmarked
2
Total users
1
Monthly active users
a day ago
Last modified
Categories
Share
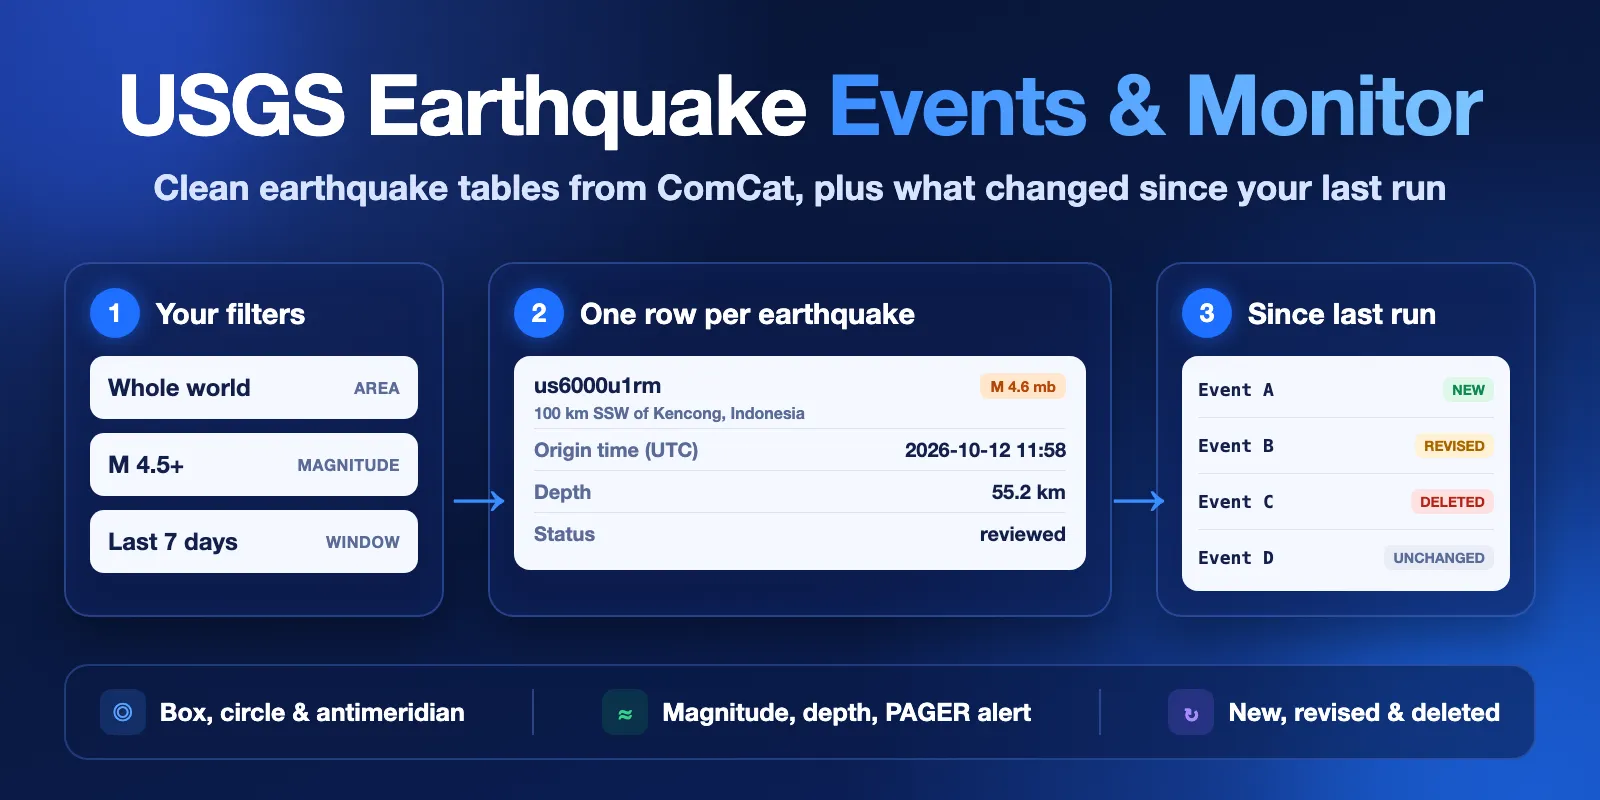
USGS Earthquake Events Export & Monitor exports earthquakes from the official USGS ComCat catalog by time window, area (a rectangle, also across the date line, or a circle), magnitude, depth, event type, review status and PAGER alert. You get one clean row per event with time, coordinates, depth, magnitude and its type, place, status, tsunami flag, felt reports, intensity, PAGER alert and USGS links.
It is made for news and media desks, risk and insurance analysts, researchers, educators and developers who need earthquake tables or a feed of changes. Save a monitor key and the next run shows only new, revised and deleted events. No login and no API key are needed. The form example (the whole world, magnitude 4.5 and up, last 7 days, up to 200 events) finishes in about 10–20 seconds and costs about $0.156.
Contents
- What it does
- Quick start
- Use cases
- Input
- Output
- Pricing
- Monitoring on a schedule
- API and integrations
- Limits
- Troubleshooting
- FAQ
- Data source and licence
- Support
What it does
The Actor reads the public USGS FDSN Event Web Service live. This is the query interface of ComCat, the USGS Comprehensive Earthquake Catalog, which merges solutions from USGS and contributing seismic networks worldwide.
- Clean rows. One row per event:
eventId,time,updated,latitude,longitude,depthKm,magnitude,magType,place,status,tsunamiFlag,felt,cdi,mmi,alert,significanceand links. Values stay as USGS publishes them; depth is not rounded. - Any area. The whole world by default, a latitude/longitude rectangle (west greater than east means it crosses the date line, for example Fiji and Tonga), or a circle around a point.
- No silent cut. When more events match than
maxResults, the run says so and, when the source answers in time, how many events match in total. - Monitoring. With a
monitorKey, the Actor saves the events it saw in your account. The next run marks each eventnew,revised(withchangedFieldsandpreviousValues, for example a new magnitude or a reviewed status),deletedorunchanged, and by default writes only the changes. - Long windows. Windows of months or years work: the Actor first reads narrow slices next to the end you sort by, and splits a window in half when USGS is overloaded.
This is USGS catalog data as published. It is not an earthquake forecast, not an early warning and not an alerting service. For warnings and safety, follow your local authorities and official tsunami warning centers.
Good fit
- A daily or weekly table of significant earthquakes for a newsroom, a blog or a dashboard.
- Earthquakes near your sites, cities or assets: a circle with
radiusKmor a rectangle. - History for research or teaching: years of M6+ events, the largest events in a region, or the oldest first.
- A feed of what changed since your last run: new events, magnitude or location revisions, reviewed status and deletions.
- Earthquake rows for a spreadsheet, BI tool, webhook or AI agent.
Not a fit
- Real-time alerts or warnings. Use the official USGS ENS service, tsunami warning centers or local systems.
- Earthquake forecasts or damage estimates beyond the PAGER alert level that USGS publishes.
- A full copy of the catalog. A run returns up to 500 events. For bulk downloads, use the USGS catalog search directly.
- ShakeMap, moment tensor or other product files. Rows link to them with
detailUrl.
Quick start
- Open the Input tab. The form already has an example: the whole world, magnitude 4.5 and up, last 7 days, up to 200 events.
- Click Start.
- Open the Events view in the Output tab. Check
time,magnitude,place,depthKmandalert. - Change the area, magnitude or time window to your own. To get only changes next time, add a
monitorKeysuch asjapan-m5.
Expected result: about 100–200 events in 10–20 seconds, newest first.
Use cases
| Job | Input | Key fields | Next step |
|---|---|---|---|
| Weekly world M4.5+ list | lastDays: 7, minMagnitude: 4.5 | time, magnitude, place, alert | Google Sheets, a newsletter, a dashboard |
| Earthquakes near a site | latitude, longitude, radiusKm | time, magnitude, depthKm, felt, mmi | Risk or facility monitoring |
| Changes since the last run | monitorKey on a schedule | changeType, changedFields, previousValues | Slack, email or a webhook |
| Largest events of a decade | startTime, sortBy: "largest" | magnitude, magType, place, tsunamiFlag | Research, teaching, charts |
| Pacific date-line region | minLongitude: 170, maxLongitude: -170 | latitude, longitude, place | Maps and GIS |
Input
| Field | What it does | Default |
|---|---|---|
lastDays | Time window ending now (or at endTime), 1–3660 days. Ignored when startTime is set. | 7 |
startTime, endTime | Exact window, at most 3660 days: a date like 2026-10-01 (00:00 UTC) or a UTC time like 2026-10-01T06:00:00Z. | none / now |
minMagnitude, maxMagnitude | Magnitude range, -2 to 10. Through the API, minMagnitude: null means no limit and also includes the few events without a magnitude. | 4.5 / none |
minDepthKm, maxDepthKm | Depth range in km, -100 to 1000. | none |
eventTypes | earthquake, quarry blast, explosion and other ComCat types. An empty list means all types. | ["earthquake"] |
alertLevel | Only events with this PAGER alert: green, yellow, orange, red. any = no PAGER filter. | any |
reviewStatus | all, reviewed (checked by a seismologist) or automatic (preliminary). | all |
minLatitude, maxLatitude, minLongitude, maxLongitude | A rectangle. West greater than east crosses the date line. | whole world |
latitude, longitude, radiusKm | A circle, radius up to 20001 km. Use a rectangle or a circle, not both. | none |
sortBy | newest, oldest or largest. With maxResults, it decides which events are kept when more match. | newest |
maxResults | Maximum event rows per run, 1–500. | 100 (form: 200) |
monitorKey | Any name. Runs with the same key compare against the previous run. | none |
previousDatasetId | Instead of monitorKey: the ID of the Dataset of an earlier run of this Actor to compare against. | none |
onlyChanges | In monitoring, write only new, revised and deleted events. Unchanged ones are counted, not written and not charged. | true |
All times are UTC. A wrong combination (for example a rectangle and a circle together, or startTime after endTime) stops the run with INVALID_INPUT and a plain message, before any request to USGS.
Input examples
Earthquakes within 300 km of Tokyo in the last 30 days:
Fiji and Tonga, across the date line:
The 20 largest earthquakes since 2017:
A weekly monitor of California, only changes:
Output
Rows go to the default Dataset. The Events view shows the main columns; the Changes view shows the change columns. A run summary is saved as RUN_SUMMARY in the key-value store.
Output example
One row from the form example (trimmed):
Fields
| Field | Meaning |
|---|---|
eventId | Preferred ComCat event ID. It can change when networks merge solutions; allIds keeps all of them. |
allIds | Every ComCat ID of this event. Use it to join or deduplicate across runs. |
time, updated | Origin time and last update at the source, ISO 8601 UTC. |
latitude, longitude | Epicenter in degrees; longitude is always -180..180, also for date-line searches. |
depthKm | Hypocenter depth in km, as published (not rounded). |
magnitude, magType | Preferred magnitude and its type (mww, mb, ml, md and others). magnitude is null for the rare events without one. |
place, title | Nearby place text from USGS, for example 85 km SE of Hachijo, Japan. |
eventType | earthquake, quarry blast, explosion and other types. |
status | automatic (preliminary), reviewed or deleted. |
tsunamiFlag | true when the event is in an oceanic region where USGS links tsunami center information. It is not a tsunami warning. |
felt, cdi | Number of "Did You Feel It?" reports and the highest reported intensity. |
mmi | Highest estimated instrumental intensity from ShakeMap. |
alert | PAGER estimated-impact alert: green, yellow, orange, red, or null when there is no PAGER estimate. |
significance | USGS significance score (magnitude, felt reports and impact combined). |
network, sources | Network of the preferred solution and all contributing networks. |
stationCount, azimuthalGapDeg | Location quality: stations used and the largest gap between them. |
url, detailUrl | USGS event page and the GeoJSON detail feed (ShakeMap, moment tensor and other products). |
changeType | initial, new, revised, deleted or unchanged in monitoring; null in a plain export. |
changedFields, previousValues | For revised and deleted events: which tracked fields changed and their previous values. |
provider, fetchedAt | Data source and the time of this run. |
Empty values are null: most events have no felt, cdi, mmi or alert. That means USGS has no such data for the event, not that the Actor lost it.
Run summary
RUN_SUMMARY.status is one of:
| Status | Meaning |
|---|---|
COMPLETE | Rows written. truncated: true means more events match; see totalAtSource and warnings. |
NO_RESULTS | No events match the filters in this window. |
NO_CHANGES | Monitoring: events match, but nothing is new, revised or deleted. |
CAPPED | The run stopped at your maximum cost per run. |
INVALID_INPUT | The input is wrong; message names the field. |
ERROR | USGS did not answer or answered with an error; message says what happened. |
It also has counts (fetched, written, charged, initial, new, revised, unchanged, deleted, duplicates skipped), the filters used, the monitoring baseline, windowSplits, warnings, request statistics and the data source attribution.
Pricing
Pay per event. Platform usage is included.
| Event | Price | When |
|---|---|---|
| Actor start | $0.003 | Once per run (per GB of memory; the default 128 MB counts once) |
| Earthquake event | $0.0009 | Each event row written to the Dataset (less on higher Apify plans, down to $0.00075) |
Unchanged events hidden by onlyChanges are free. A run with no results, no changes, an input error or a USGS error costs only the start.
| Run | Example cost |
|---|---|
| 10 events | $0.012 |
| ~170 events (form example, a typical week of M4.5+) | about $0.156 |
| 500 events (maximum) | $0.453 |
| Monitor run with 5 changes | $0.0075 |
| No results or no changes | $0.003 |
Set a maximum cost per run in the run options to cap your spend. The Actor stops before a row that does not fit and reports CAPPED.
Monitoring on a schedule
- Save your input as a task and add a
monitorKey, for examplejapan-m5. - Add an Apify schedule to the task, for example every hour or every day.
- The first run marks all rows
initialand saves a snapshot. Each later run writes onlynew,revisedanddeletedevents. - Send the rows to email, Slack, Google Sheets or a webhook with Apify integrations.
The snapshot is kept in your account in the named key-value store usgs-earthquake-events-monitor, under SNAPSHOT-<monitorKey>. Use one key per saved search. Deleted events are checked for windows up to 31 days. An event that changes after it leaves your time window is not seen. Use a window longer than your schedule interval (for example lastDays: 7 for a daily run) so late revisions are caught. This is a convenience tool, not an alerting service, and it does not promise that you see every change in time.
API and integrations
Start a run with the same JSON input through the Apify API (POST /v2/acts/cliqtomedia~usgs-earthquake-events/runs), then read the Dataset. Export to CSV, Excel, JSON or XML, or send rows to Google Sheets, Slack or a webhook with Apify integrations. Join rows on eventId or any value in allIds.
Use with AI agents (MCP)
AI agents can call this Actor through the Apify MCP server: add https://mcp.apify.com?tools=cliqtomedia/usgs-earthquake-events to your MCP client (Claude, Cursor, VS Code and others). The MCP server needs your Apify account (OAuth sign-in or an Apify API token); USGS itself needs no key. The smallest useful input:
Key output fields for an agent: time, magnitude, place, depthKm, alert, tsunamiFlag, url, and RUN_SUMMARY.status. A week of world M4.5+ events finishes in 10–20 seconds and costs about $0.156. maxResults is at most 500.
Limits
- Up to 500 events per run. When more match, the run reports
truncated: true, the total when USGS counts it in time, and a hint. USGS itself refuses lists of more than 20,000 events, so split very large exports into several runs by time. - Time windows up to 3660 days (about 10 years), with
lastDaysor withstartTime/endTime. For older history, use several runs. Long windows are read in narrow slices first; in our tests 10-year windows finished in 18–45 seconds. The internal time budget is 270 seconds. - If USGS times out or answers 5xx, a window of 12 hours or more is split in half and read again. The run then skips the total count.
- A monitor baseline (the
monitorKeysnapshot or thepreviousDatasetIdrows) has a safety cap of 20,000 events. We tested baselines of up to 500 events. - Deletions are checked only in monitoring and only for windows up to 31 days.
- ComCat updates events after they happen: automatic solutions are revised, magnitudes change, events are merged (the preferred
eventIdcan change) or deleted. Small events outside the U.S. are often not in ComCat at all.
Troubleshooting
| Symptom | Check | Action |
|---|---|---|
NO_RESULTS | RUN_SUMMARY.filters | Widen the time window or area, or lower minMagnitude. Check eventTypes and alertLevel. |
truncated: true | totalAtSource, warnings | Raise maxResults (up to 500), narrow the window or area, or raise minMagnitude. |
ERROR, USGS unavailable or timed out | RUN_SUMMARY.message | Run again later or use a shorter window. A failed run does not change your monitor snapshot. |
INVALID_INPUT | RUN_SUMMARY.message | Fix the field named in the message. |
An event appears as revised | changedFields, previousValues | USGS updated it, often magnitude, location or status after review. |
An event appears as new although you saw it before | allIds | USGS may have merged solutions and changed the preferred ID. |
| Warning about different filters | RUN_SUMMARY.warnings | You changed filters but kept the same monitorKey. Use one key per saved search. |
FAQ
Is this an earthquake warning service?
No. It exports the USGS catalog. For warnings and safety, follow official sources and local authorities.
Where does the data come from?
From the USGS Earthquake Hazards Program: the ComCat catalog through the FDSN Event Web Service. Each run reads it live.
Do I need an API key?
No. The USGS service is public.
Why does a magnitude change between runs?
The first solution is automatic. Seismologists review it later and may change the magnitude, its type, the location or the depth. Monitoring shows these as revised with the previous values.
Does tsunamiFlag: true mean there was a tsunami?
No. It only means that USGS links tsunami center information for the event. Check official tsunami warning centers.
Does monitoring cost more?
No. Unchanged events are not written and not charged when onlyChanges is on.
Data source and licence
Data: U.S. Geological Survey, Earthquake Hazards Program, ComCat through the FDSN Event Web Service. USGS-authored data is in the U.S. public domain (USGS copyrights and credits); please credit "U.S. Geological Survey". Events from contributing networks keep their network codes in network and sources. This Actor is independent and not affiliated with or endorsed by the U.S. Geological Survey.
Support
Use the Issues tab of this Actor. Add the run ID, your input and RUN_SUMMARY.status and message. Do not send API tokens.


