

Chart Image Generator: Chart.js & ECharts to PNG, SVG, PDF
Pricing
Pay per event
Chart Image Generator: Chart.js & ECharts to PNG, SVG, PDF
Turn data or a Chart.js or ECharts config into chart images: PNG, SVG, PDF, WebP or JPEG. Bar, line, pie, scatter, candlestick, sankey and more, from labels and values, CSV, JSON or an Apify dataset. A QuickChart alternative for AI agents.
Pricing
Pay per event
Rating
0.0
(0)
Developer

Jumble Mog
Maintained by CommunityActor stats
0
Bookmarked
2
Total users
1
Monthly active users
12 days ago
Last modified
Categories
Security
Limited permissionsShare
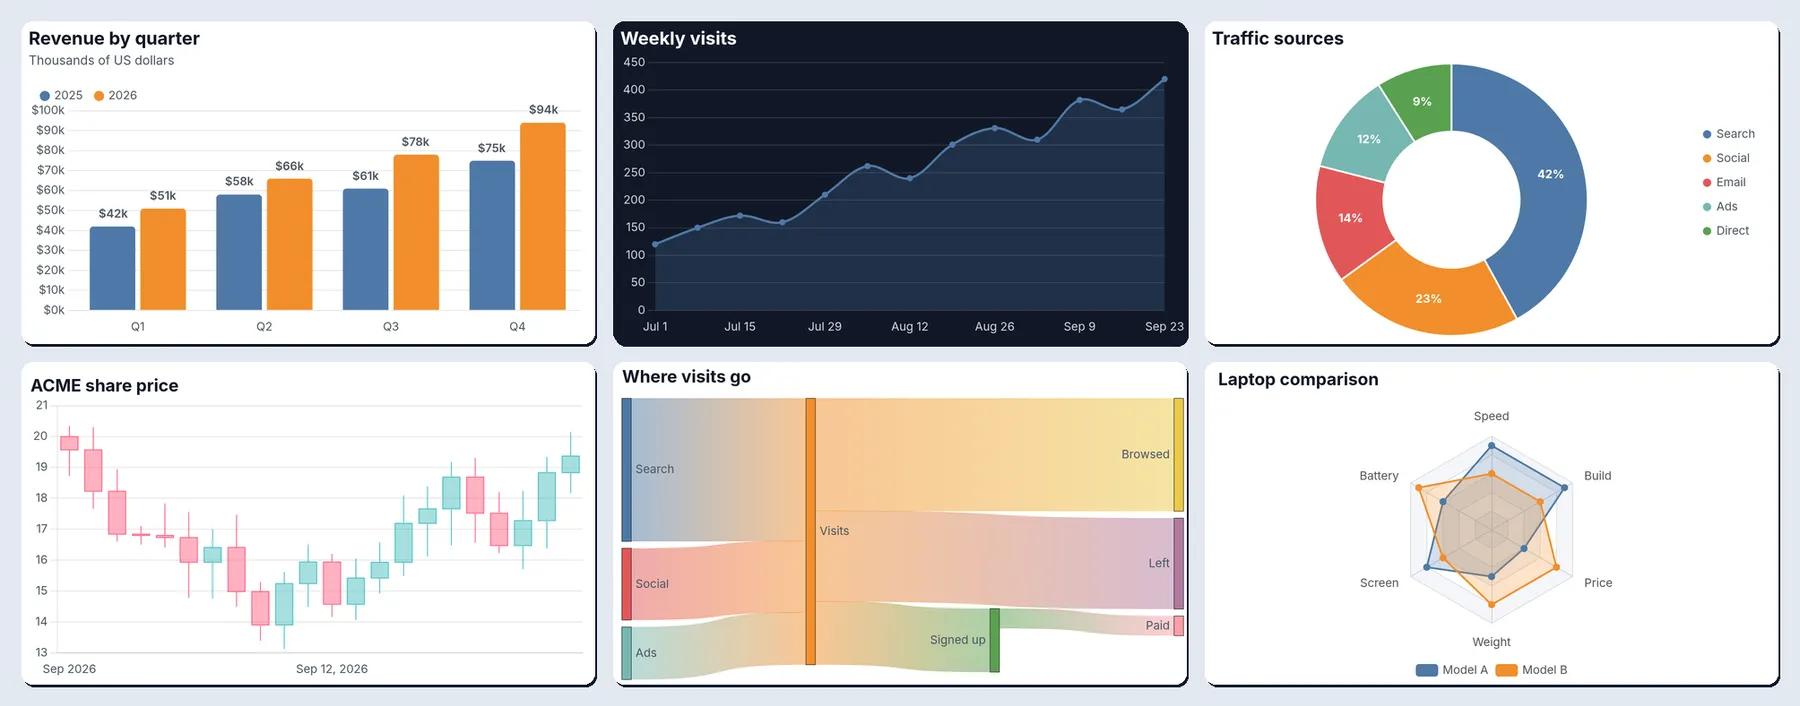
Turn data into chart images. Send a Chart.js config, an Apache ECharts option, or just your data (labels and values, CSV, JSON rows, a link to a data file, or the dataset of another Actor run), and get back a clean chart as PNG, SVG, PDF, WebP or JPEG with a download link. Bar, line, area, pie, doughnut, scatter, radar, mixed bar and line, candlestick, sankey, treemap, heatmap, box plot, word cloud, gauge and more. It reads the same Chart.js configs as QuickChart, including old Chart.js 2 configs, so it works as a pay-per-chart QuickChart alternative that people, automations and AI agents can call.
What it does
- Chart.js configs:
{"type": "bar", "data": {...}, "options": {...}}, drawn with Chart.js 4. Chart.js 2 configs (the version QuickChart uses by default, and what many AI models write) are converted automatically:xAxesandyAxes,horizontalBar, top-leveltitleandlegend,scaleLabel,gridLines,ticks.beginAtZero,cutoutPercentage,lineTensionand v2 annotations. Configs written as JavaScript can contain functions, such as tick and label formatters. - Plugins included: data labels, annotations (lines, boxes, labels), time axes, candlestick and OHLC (financial), matrix (heatmaps), sankey, treemap, box plot and violin, and word cloud charts.
- Apache ECharts options: line, bar, pie, scatter, radar, gauge, funnel, heatmap, treemap, sunburst, sankey, candlestick, box plot, graph, parallel, theme river and calendar charts, with ECharts' own light and dark themes.
- Charts from plain data, no config needed: labels with one or more series, CSV or TSV text, JSON rows, an Apify dataset ID, or a link to a CSV or JSON file or a public Google Sheet. Pick the label and value fields (nested fields like
stats.viewswork), add up, count, average or take the min or max of rows that share a label, sort, and keep the top N. Dates become a time axis, and a series can be a line over bars or use a second axis. - Styled by default: a left-aligned title and subtitle, round legend markers, soft grid lines, rounded bars, and value labels with your prefix, suffix and decimals (
$1,200,45%,3.5 kg). - Five formats: PNG at 1x to 4x pixel density, SVG and PDF as vector files that stay sharp at any size, lossless WebP, and JPEG. One charge per chart, whatever the number of formats.
- Look: light or dark theme, any background color or transparent, six palettes (including a colorblind-safe one) or your own colors, 13 fonts, and number and date formats for any locale (
de-DEwrites 1.234,5). - Emoji and every script: color emoji, Chinese, Japanese and Korean, Greek and Cyrillic in titles, labels and legends.
- Errors that say what to fix: an unknown chart type lists the ones that exist, a broken config gives the JavaScript error and line, a missing field lists the fields in your data. Failed charts are free.
- Image straight from the API: the first chart is also the run's
OUTPUT, so the run-sync endpoint answers with the image itself.
Who it's for
- AI agents and LLM apps that answer with a chart: write a Chart.js config (most models know the format) or pass the numbers, and show the image in a chat, report, email or slide.
- Automation builders in n8n, Make or Zapier who send weekly KPI charts to Slack, email or Notion.
- Apify users who want to see their scraped data: chart prices, ratings, review counts or items per category straight from a scraper's dataset.
- Developers who need server-side chart images without running a browser, or a QuickChart replacement priced per chart.
How to use it
- Paste a Chart.js config or an ECharts option into Chart config, or fill in Labels and Series, or paste a CSV into CSV data.
- Choose a chart type, title, theme and colors, or keep the defaults.
- Click Start. The chart appears in the Output tab with its download link.
For many charts in one run, put them in More charts. You can also run it through the Apify API, on a schedule, or from Make, n8n, Zapier and other integrations.
Input
| Field | What it does |
|---|---|
chart | A Chart.js config (type, data, options) or an ECharts option (series, xAxis, ...). |
chartCode | The same kind of config as JavaScript text, which may contain functions. Markdown code fences are removed. |
engine | auto (default), chartjs or echarts. |
charts | More charts: configs, configs as text, or objects with chart (or data fields) and their own settings, such as {"chart": {...}, "name": "sales", "width": 1200}. |
chartType | For charts from data: bar (default), horizontalBar, stackedBar, horizontalStackedBar, line, area, stackedArea, pie, doughnut, polarArea, radar or scatter. |
labels, series, values | Labels with named series ([{"name": "Sales", "values": [3, 5]}], optionally with "type": "line", "axis": "right" and "color"), or one list of values. |
csv, data, datasetId, dataUrl | Data as CSV or TSV text, JSON rows, the ID of an Apify dataset (up to 100,000 items), or a link to a public CSV or JSON file or Google Sheet (up to 10 MB). |
xField, yFields | The field with the labels and the fields with the values. Default: the first text column and every number column. |
aggregate, sortBy, limit | Combine rows with the same label (auto, none, sum, count, average, min, max), sort (valueDesc, valueAsc, label) and keep the top N. |
title, subtitle, xAxisTitle, yAxisTitle | Text for charts made from data. |
showValues, valuePrefix, valueSuffix, decimals | Write the values on the chart, and how numbers look. |
legend, beginAtZero, smooth | Legend position or none, the value axis starting at zero (default on), and curved lines. |
width, height | Chart size in CSS pixels (800 x 450 by default, up to 4,000 each). |
theme, background | light (default) or dark, and any CSS color or transparent. |
palette, colors | tableau10 (default), colorblind, vivid, pastel, chartjs or echarts, or your own list of colors. |
fontFamily, fontSize, locale | Inter (default), Roboto, Open Sans, Lato, Montserrat, Poppins, Source Sans 3, Noto Sans, IBM Plex Sans, Nunito, Arial, Noto Serif or JetBrains Mono; the base size (12 px); and the number and date locale (en-US). |
formats, scale | Any of png (default), svg, pdf, webp and jpg, and the pixel density of PNG, WebP and JPEG (2 by default). |
name, inlineImage, maxCharts | The files' name, the image as a base64 data URI in the results, and the most charts per run (100). |
The data, title and value settings in the form belong to the chart in the form; every chart in More charts has its own. The look and output settings apply to every chart unless a chart sets its own. A chart in More charts that sets only chartType, xField, yFields, aggregate or sortBy uses the form's data, so one dataset or CSV can be drawn several ways in one run.
A Chart.js config, the way QuickChart takes it:
A chart from a scraper's dataset: the ten brands with the most products, largest first:
A CSV, with the rows of each region added up:
Orders as bars with the conversion rate as a line on a second axis:
An ECharts gauge on the dark theme:
How-to examples
Each example below is a complete input, checked with a run of the Actor.
How to turn a Chart.js config into a PNG image (a QuickChart alternative)
Result: a grouped bar chart as a 1600 x 900 PNG (800 x 450 at 2x) in pngUrl and a vector SVG in svgUrl, made in about 1.4 seconds.
How to make a line chart from CSV data
Result: a dark line chart. The dates become a time axis (Sep 7 to Oct 5), so gaps between weeks are drawn to scale. A link to a CSV file or a public Google Sheet works the same way in dataUrl.
How to chart scraped data: count items per category
Give JSON rows here, or the datasetId of a scraper run:
Result: horizontal bars Acme 3, Bolt 2, Cora 1, largest first, with the counts written on the bars. Use "aggregate": "average" and "yFields": ["price"] for the average price per brand instead.
How to let an AI agent answer with a chart
Add this Actor to the Apify MCP server with https://mcp.apify.com/?tools=jumblemog/chart-image-generator. Most models already write Chart.js configs, including old Chart.js 2 ones, which are converted. The agent sends the config in chart and shows the user imageUrl. A broken config comes back with the JavaScript error and line, so the agent can fix it and try again.
FAQ
Can it replace QuickChart? Yes, for drawing images. It reads the same Chart.js configs, including Chart.js 2 ones, and you pay per chart instead of a monthly plan.
Which chart types are there? Bar, line, area, pie, doughnut, scatter, radar, mixed bar and line, candlestick, sankey, treemap, heatmap, box plot, word cloud and gauge, plus every Apache ECharts chart.
Can I get SVG or PDF? Yes. formats takes any of png, svg, pdf, webp and jpg, and one chart costs the same whatever the number of formats.
Can I get the image itself from the API? Yes. The first chart is also the run's OUTPUT, so the run-sync endpoint answers with the image.
Does it work with Zapier, Make or n8n? Yes. Call the Actor with its Apify app or an HTTP request, then send imageUrl to Slack, email or Notion.
Output
Each chart becomes one dataset item, and the files are saved in the run's key-value store:
When a chart can't be drawn, the item says why and isn't billed:
Download your files within your plan's data retention period, or copy them to your own storage, because run storage expires.
Pricing
You pay per chart created, at the price shown on this page, whatever the number of formats (PNG, SVG, PDF, WebP and JPEG of the same chart count once). Charts that can't be drawn are never charged. If you set a maximum cost per run, the Actor stops when the next chart wouldn't fit.
Speed
One chart usually takes 3 to 4 seconds through the API, from request to image, most of it the run starting up. Each further chart in the same run adds about 0.2 to 0.7 seconds as PNG, or 1 to 2 seconds with all five formats (sankey and word cloud charts take longer). On Apify more memory also means more CPU, so give big batches 2 GB or more to draw them faster.
Tips and limits
- Chart.js configs given as JSON can't contain functions; send the config as JavaScript text in
chartCode(or as a string incharts) when it has formatters or callbacks. Text that isn't valid JSON is read as JavaScript. - Images inside configs (point styles, ECharts image symbols and graphics) and data URLs inside configs aren't loaded: the renderer has no network access. Give the data in the config, or use the data fields.
- ECharts maps (which need GeoJSON registered first) and 3D charts (ECharts GL) aren't available. For Vega-Lite specs, Mermaid diagrams and Graphviz graphs, use the Diagram Renderer Actor.
- Chart.js SVG files have their text turned into outlines, so they look the same everywhere; color emoji show in PNG, WebP, JPEG and PDF files but not in Chart.js SVGs. ECharts SVG files keep text as text in the chosen font.
- Data: up to 100,000 dataset items, files up to 10 MB, 10,000 labels and 20 series per chart. Each chart has a 60-second limit.
- Datasets: Apify lets this Actor read only the dataset picked in its Apify dataset field (
datasetIdat the top of the input), so charts in More charts can use that dataset but no other. To chart several datasets, run once per dataset. - Candlestick and OHLC points take
xas a date (text such as2026-09-01, or a timestamp in milliseconds or seconds) witho,h,landcprices, and are put in time order.[time, open, high, low, close]lists work too. - Data file links: CSV, TSV and JSON files, GitHub file links, and Google Sheets links (the sheet must be shared as "Anyone with the link" or published to the web; a
gidin the link picks the tab). Every site's robots.txt is checked first, and its crawl delay kept.
For AI agents and developers
This Actor works with the Apify MCP server, so AI agents can call it as a tool: pass a Chart.js config in chart (or labels and series) and read imageUrl from the dataset item. For a direct API call that waits for the result:
To get the image itself as the response, call run-sync instead. It returns the run's OUTPUT, which is the first chart (or the error as JSON):
Credits
- Chart.js with chartjs-plugin-datalabels, chartjs-plugin-annotation, chartjs-adapter-date-fns and date-fns, and the financial, matrix, sankey, treemap, box plot and word cloud charts (all MIT), d3-cloud (BSD-3-Clause), Apache ECharts (Apache-2.0) with ZRender (BSD-3-Clause), drawn with Skia (BSD-3-Clause) through @napi-rs/canvas (MIT), and Pillow (MIT-CMU).
- Fonts (SIL Open Font License): Inter, Roboto, Open Sans, Lato, Montserrat, Poppins, Source Sans 3, Noto Sans, IBM Plex Sans, Nunito, Arimo (drawn for Arial and Helvetica), Noto Serif and JetBrains Mono from Google Fonts, Noto Color Emoji and Noto Sans CJK, and DejaVu Sans (Bitstream Vera).
- This Actor isn't affiliated with QuickChart, Chart.js, Apache ECharts or the projects above.


