

Frost Dates & Growing Degree Days Calculator
Pricing
Pay per event
Frost Dates & Growing Degree Days Calculator
Frost dates with 1-in-10 odds, frost-free season, vegetable planting calendar, and growing degree days for corn, grapes and other crops vs the average, for any place from NASA daily temperatures since 2001.
Pricing
Pay per event
Rating
0.0
(0)
Developer

Jumble Mog
Maintained by CommunityActor stats
0
Bookmarked
2
Total users
1
Monthly active users
5 days ago
Last modified
Categories
Security
Limited permissionsShare
Frost dates, the growing season, a planting calendar and growing degree days for any place in the world, from one line of text. Ask frost dates for Minneapolis, when to plant tomatoes, peppers, peas and lettuce in Denver or growing degree days for corn in Des Moines planted May 1 and you get back:
- Frost dates: the median last spring and first autumn frost at 36°F (frost on the ground likely), 32°F (light freeze) and 28°F (hard freeze), with the 1-in-10 dates (90% of years are past the last frost by then) and the frost-free season in days.
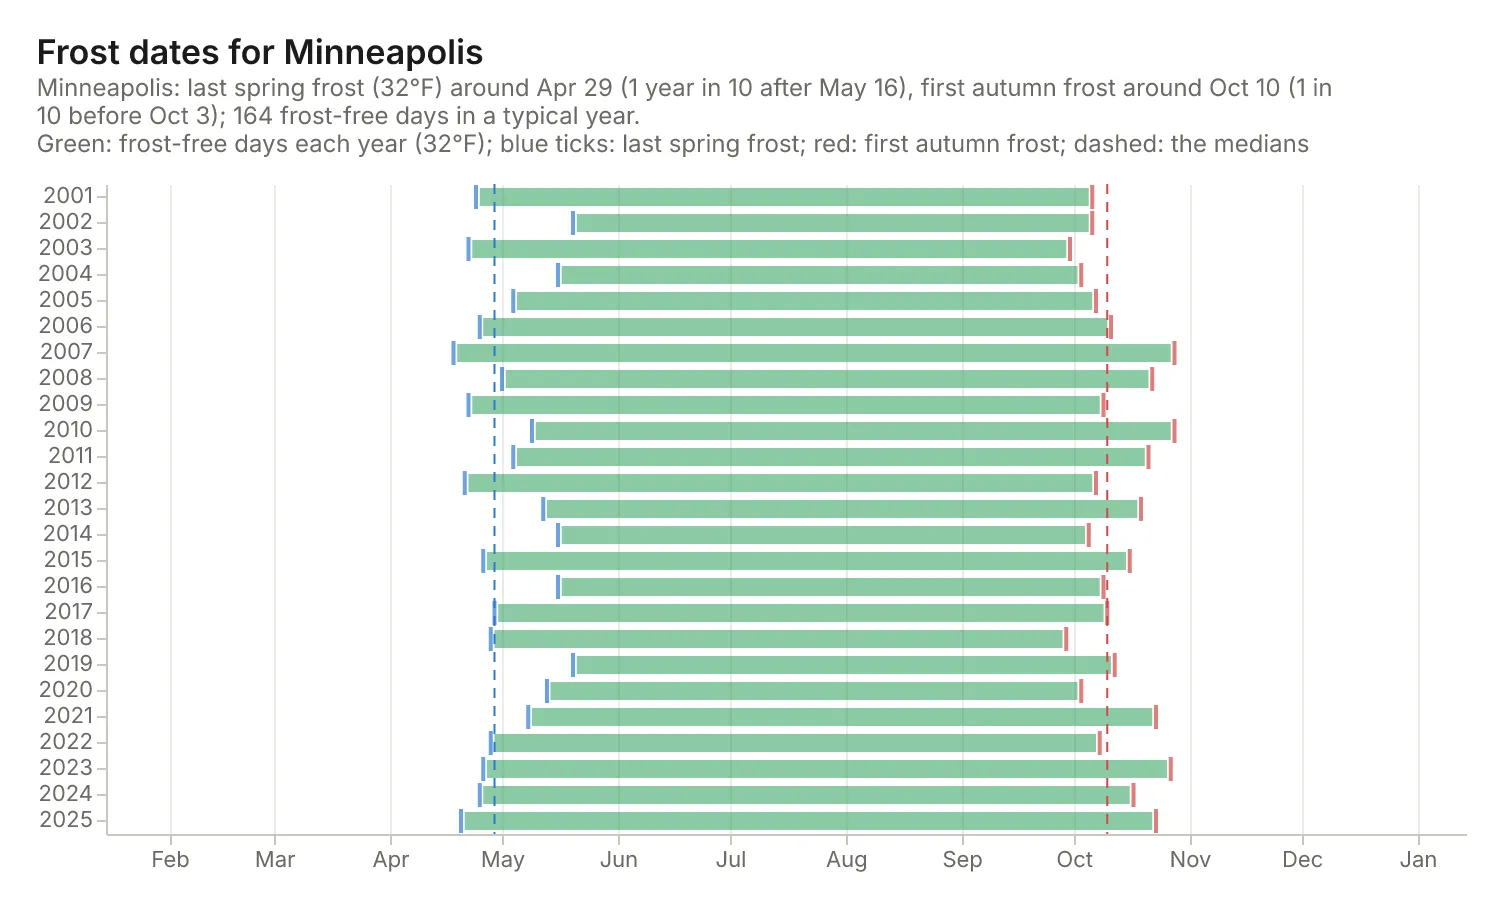
- Every year since 2001: each year's last and first frost dates and frost-free days.
- A planting calendar: when to start seeds indoors and plant out tomatoes, peppers, peas, lettuce and 20 more vegetables, and the first harvest, from the median last frost. It warns when a tender crop won't ripen before the first autumn frost.
- Growing degree days: this season's total for a crop (corn, soybeans, wheat, cotton, alfalfa, potatoes, grapes and more) or any base temperature from a planting date, against the 2001-2025 average and its 1-in-10 range, with how this season ranks, when a target (2,700 GDD for corn) is or should be reached, and the Winkler index and region for vineyards.
- A chart: each year's frost-free season, or the degree days through the season against the average.
It's made for:
- Gardeners and allotment holders deciding when to sow and plant out.
- Farmers and agronomists tracking crop development, corn maturity and pest timing.
- Vineyard planners comparing sites by the Winkler index.
- Seed companies, garden apps, extension services and AI agents that need frost dates and degree days for any place, not just US ZIP codes.
How to use it
- Write Places and questions, one per entry. The form has examples.
- Optionally set the Units: °F in the US and °C elsewhere by default.
- Click Start. Each request is a row in the results, with its summary, chart and report.
What you can write
| You write | It means |
|---|---|
Minneapolis, Leeds, UK, Christchurch, New Zealand, 44.98, -93.27 | Where (a town of 5,000+ people or coordinates) |
frost dates for ..., last frost, growing season | Frost dates |
when to plant tomatoes and peas in ..., planting calendar for ... | A planting calendar (named crops, or 12 common vegetables) |
growing degree days for corn in ..., GDD, heat units | Degree days for a crop |
base 10°C, base 50°F, cap 86°F | Your own base and upper threshold |
planted May 1, since April 15, 2,600 GDD, 2012 | Start date, target and season |
Winkler index for Napa | Grapes: degree days above 50°F, 1 April to 31 October |
The same as an object: {"place": "Guelph, Canada", "type": "frost", "crops": ["tomato", "bean"]} or {"lat": 48.85, "lon": 2.35, "base": 10, "units": "metric", "start": "04-01"}.
Examples
frost dates for Minneapolis→ last spring frost (32°F) around Apr 29 (1 year in 10 after May 16), first autumn frost around Oct 10 (1 in 10 before Oct 3); 164 frost-free days. NOAA's 1991-2020 normals for the airport are about Apr 30 and Oct 8.when to plant tomatoes, peppers, peas and lettuce in Denver→ last frost around May 14: start tomatoes indoors Mar 19-Apr 2 and plant out May 21-Jun 4; sow peas Apr 2-16.growing degree days for corn in Des Moines, Iowa planted May 1→ 3,565 °F GDD to Oct 21 2026, 9% ahead of the 2001-2025 average; 2,700 GDD reached Aug 31 (normally Sep 8).Winkler index for Walla Walla, Washington→ 1,978 in a normal season (region I).planting calendar for Leeds, UK→ last frost (0°C) around Apr 18, first around Nov 17, and when to sow 12 vegetables.frost dates for Christchurch, New Zealand→ southern seasons: last spring frost around Sep 3, first autumn frost around Jun 11.
How-to examples
Each example is a complete input; the results are from runs of the Actor (also listed under Examples).
How to find the last frost date for your town
Result: "Minneapolis: last spring frost (32°F) around Apr 29 (1 year in 10 after May 16), first autumn frost around Oct 10 (1 in 10 before Oct 3); 164 frost-free days in a typical year." NOAA's 1991-2020 normals for the airport are about Apr 30 and Oct 8.
How to know when to plant vegetables
Result: last frost around May 14, so start tomatoes indoors Mar 19-Apr 2 and plant them out May 21-Jun 4, and sow peas Apr 2-16. It works anywhere: planting calendar for Leeds, UK gives frost dates at 0°C and when to sow 12 vegetables, and southern-hemisphere places get southern seasons.
How to track growing degree days for a crop
Result: 3,565 °F GDD to Oct 21 2026, 9% ahead of the 2001-2025 average, with 2,700 GDD reached on Aug 31 (normally Sep 8). Grape growers can ask for the Winkler index: 1,978 for Walla Walla, Washington (region I).
How to let an AI agent answer gardening questions
Add this Actor to the Apify MCP server with https://mcp.apify.com/?tools=jumblemog/growing-season-calculator. The agent passes the question as written and answers with frost dates and planting windows from 25 years of daily temperatures for the place, instead of a hardiness-zone guess.
FAQ
Where does the data come from? NASA POWER's daily highs and lows for the place, from 2001 to a few days ago.
What does "1 year in 10" mean? The frost date is a typical date; in 1 year out of 10 the last spring frost comes later than the second date. Planting after it is safer.
Does it work outside the US? Yes, anywhere in the world, in °F or °C.
Can it track this season? Yes. Growing degree days run to a few days ago and are compared with the average. This season's numbers come from NASA's near-real-time analysis, so treat the comparison as approximate.
Input
| Field | What it is |
|---|---|
requests | Places and questions, as lines of text or objects (up to 200 per run) |
units | auto (°F in the US, °C elsewhere), us or metric |
charts | Draw a chart for each request (default on) |
Output
One dataset item per request, also saved together in the run's OUTPUT record:
Degree-day items have gdd (crop, base, cap, method, start, through, accumulated, normalToDate, departure, departurePercent, normalSeasonTotal, rankWarmest, target, targetDate, normalTargetDate, winklerIndex, winklerRegion) and monthly instead. Every item also has place, warnings, notes (the method and every assumption), a Markdown report and links to the chart and report. A request that can't be computed has "status": "failed" and the reason in error, and isn't billed.
How it works
- Temperatures: NASA POWER's daily 2 m highs and lows for the point from 2001 to a few days ago (MERRA-2 reanalysis, then NASA's near-real-time GEOS analysis).
- Frost: in each year, the last day before midsummer and the first day after it with a low at or below the threshold (midwinter is 15 January in the north and 15 July in the south). The median and the 10th and 90th percentiles over the years give the dates, as in NOAA's freeze tables.
- Planting calendar: weeks before or after the median last frost for each crop (peas 6-4 weeks before, tomatoes 1-3 weeks after, seeds indoors 6-10 weeks before), plus typical days to harvest.
- Degree days: each day's average of high and low less the base (never below zero); for corn and soybeans the modified method raises the low to 50°F and caps the high at 86°F. Summed from the start date, against the average and the 10th-90th percentile of 2001-2025.
Pricing
You pay one low price per request, at the price shown on this page. The chart and report are included. Requests that can't be computed are never charged. If you set a maximum cost per run, the Actor stops before a request that wouldn't fit.
Speed
A request takes about a second (25 years of daily data for a place is fetched once per run). A run through the API answers in about 10-15 seconds, including the cloud container starting.
Tips and limits
- Grid cells: the temperatures are for a cell about 50 km across. Low spots and valleys frost earlier in autumn and later in spring than the cell, and city centres and coasts less; use the 1-in-10 dates for frost-tender plants.
- This season comes from NASA's near-real-time analysis, which can differ from the long record the average uses; treat its departure from the average as approximate.
- Planting windows are rules of thumb; seed packets and local extension services know your varieties.
- Limits: 200 requests per run; places need NASA POWER to answer.
For AI agents and developers
This Actor works with the Apify MCP server, so AI agents can call it as a tool. Pass requests as plain text and read summary, frost, calendar, gdd and warnings. A direct API call that waits for the answer:
run-sync instead returns the run's OUTPUT: the status, the counts and every result as JSON.
In Python, with the apify-client package:
Credits
- Temperatures: NASA POWER (NASA Langley Research Center POWER Project, funded through the NASA Earth Science Directorate Applied Science Program; public).
- Places: GeoNames via geonamescache (CC BY 4.0, MIT).
- Math: NumPy (BSD-3-Clause). Charts: Vega-Lite and vl-convert (BSD-3-Clause), with the Inter font (SIL Open Font License).
- Methods: NOAA freeze probability tables; the modified growing degree day method (McMaster and Wilhelm 1997); the Winkler index (Amerine and Winkler 1944).


