
Cboe Macro Volatility
Pricing
Pay per usage
Cboe Macro Volatility
Macro volatility intelligence and tail-risk engine tracking official CBOE indices. Key Capabilities: Ingests VIX (30-day implied vol), VVIX (volatility of volatility), and SKEW (black-swan tail risk index). Generates the Exhibit 1 Implied Volatility vs. Realized Volatility (IV-RV) Spread Matrix.
Pricing
Pay per usage
Rating
0.0
(0)
Developer

khalid naami
Maintained by CommunityActor stats
1
Bookmarked
2
Total users
1
Monthly active users
23 days ago
Last modified
Categories
Share
Cboe Macro Volatility & Institutional Quant Risk Analytics Actor
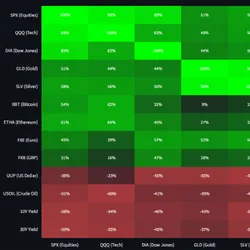
Institutional-grade cross-asset volatility monitor, Cboe SKEW Black Swan Tail-Risk Model, Exhibit 1 Global Implied vs Realized Volatility Spread Matrix, VIX/VVIX Vol-of-Vol Dynamics, and 1-Month Cross-Asset Correlation Heatmap.
🚀 Key Frameworks & Quantitative Models
1. Cboe SKEW Index (^SKEW) — Black Swan & Crash Risk Model
The Cboe SKEW Index measures the relative pricing of deep Out-of-the-Money (OTM) Put options on the S&P 500 relative to At-the-Money options, quantifying institutional crash hedging demand:
< 120(Low Tail Risk / Benign Floor): Minimal crash hedging; OTM put insurance is historically cheap.120 – 135(Normal Historical Corridor): Balanced institutional hedging equilibrium.135 – 155(Elevated Tail Risk): Aggressive institutional put purchasing; elevated crash awareness.155 – 160(Extreme Peak / Reversal Ceiling): Tail hedges reached maximum satiation and extreme expense. Historically marks reversal exhaustion.165 – 170+(Black Swan Crisis Spike): Rare global systemic shock level (e.g., 2008 Lehman collapse, 2020 COVID shock).
2. Exhibit 1: Global Volatilities & Realized Spread Matrix
Evaluates 14+ major global asset classes (SPX, NDX, DIA, Russell 2000, Gold, Silver, Bitcoin, Ethereum, Euro, GBP, Dollar Index, Crude Oil, 10Y Yield, 30Y Yield):
- 1-Month Implied Volatility ($IV_{1M}$)
- 1-Month Realized Volatility ($RV_{1M} = \text{std}(\text{ret}_{21d}) \times \sqrt{252} \times 100$)
- Variance Risk Premium Spread ($IV - RV$): Identifies overpriced options (rich premium to harvest) vs underpriced options (cheap protection).
- 1-Year Historical IV Percentile ($P_{\text{IV}}$).
3. VIX vs VVIX Dynamics (Vol-of-Vol Velocity)
- Measures the pricing velocity and uncertainty of equity market volatility itself.
- High VVIX ($> 110$) indicates sharp hedging rotation and explosive tail-risk acceleration.
4. 1-Month Cross-Asset Correlation Heatmap (21 Trading Days)
- Computes daily rolling pairwise Pearson correlations between equities, crypto, precious metals, FX, oil, and treasury yields to identify asset decoupling and hedging effectiveness.
📥 Input Parameters
| Parameter | Type | Default | Description |
|---|---|---|---|
lookbackPeriod | String | "1y" | Lookback period for historical volatility curves and 1-year percentiles (6mo, 1y, 2y, 5y). |
correlationWindowDays | Integer | 21 | Rolling trading days for pairwise cross-asset correlation matrix (default 21 days = 1 month). |
includeCorrelationMatrix | Boolean | true | Compute full pairwise correlation matrix. |
includeHistoricalSeries | Boolean | true | Include historical time-series datasets. |
📤 Output Structure
1. Default Dataset (Exhibit 1 Spreads Table)
2. Key-Value Store (OUTPUT)
Comprehensive JSON object containing:
liveIndices: Real-time snapshots of VIX, VVIX, SKEW, VXN, RVX, GVZ, OVX.skewTailRiskModel: Tail-risk regime status, benchmark bands, and actionable bias.vixVvixDynamics: Vol-of-vol stress level and ratio.globalVolatilitiesExhibit1: Full asset class spread table.crossAssetCorrelationMatrix: Pairwise correlation heatmap values.automatedQuantNarrative: Institutional macro commentary.
🎯 Institutional Use Cases
- Options Selling & Premium Harvesting: Systematically spot assets with elevated positive Variance Risk Premiums ($IV \gg RV$).
- Tail-Risk Hedging & Portfolio Protection: Time tail-risk put hedge acquisitions when SKEW is low ($< 120$) and avoid buying hedges at extreme ceiling zones ($> 155$).
- Cross-Asset Volatility Arbitrage: Capitalize on volatility dislocations across equities, crypto, oil, and gold.


