

Google Trends Scraper & API - Related Queries & Trending Now
Pricing
from $1.05 / 1,000 keyword reports
Google Trends Scraper & API - Related Queries & Trending Now
Google Trends scraper and API alternative: interest over time, interest by country and region, top and rising related queries and topics, peak date and trending now, as plain rows.

Google Trends Scraper gives you Google Trends data for any keyword in one row: interest over time (every point with its period start/end, isPartial and hasData), interest by country or region, related queries (top and rising), plus a ready summary — average interest, peak date and whether the trend is rising or falling. Compare up to 5 keywords on one chart — or any number through a common anchor term — use topic IDs (/m/…, /g/…), get 4–5 years weekly + 90 days daily + 7 days hourly in one run with an optional versioned stitched series, and pull Trending Now searches for any country. Every row carries a data contract (provenance with parser/schema version, checksum, the request and the window Google resolved).
$0.0015 per keyword report, $0.0005 per Trending Now search. No login, no API key, no start fee. Keywords that fail are free.
Tested head-to-head — 9 October 2026
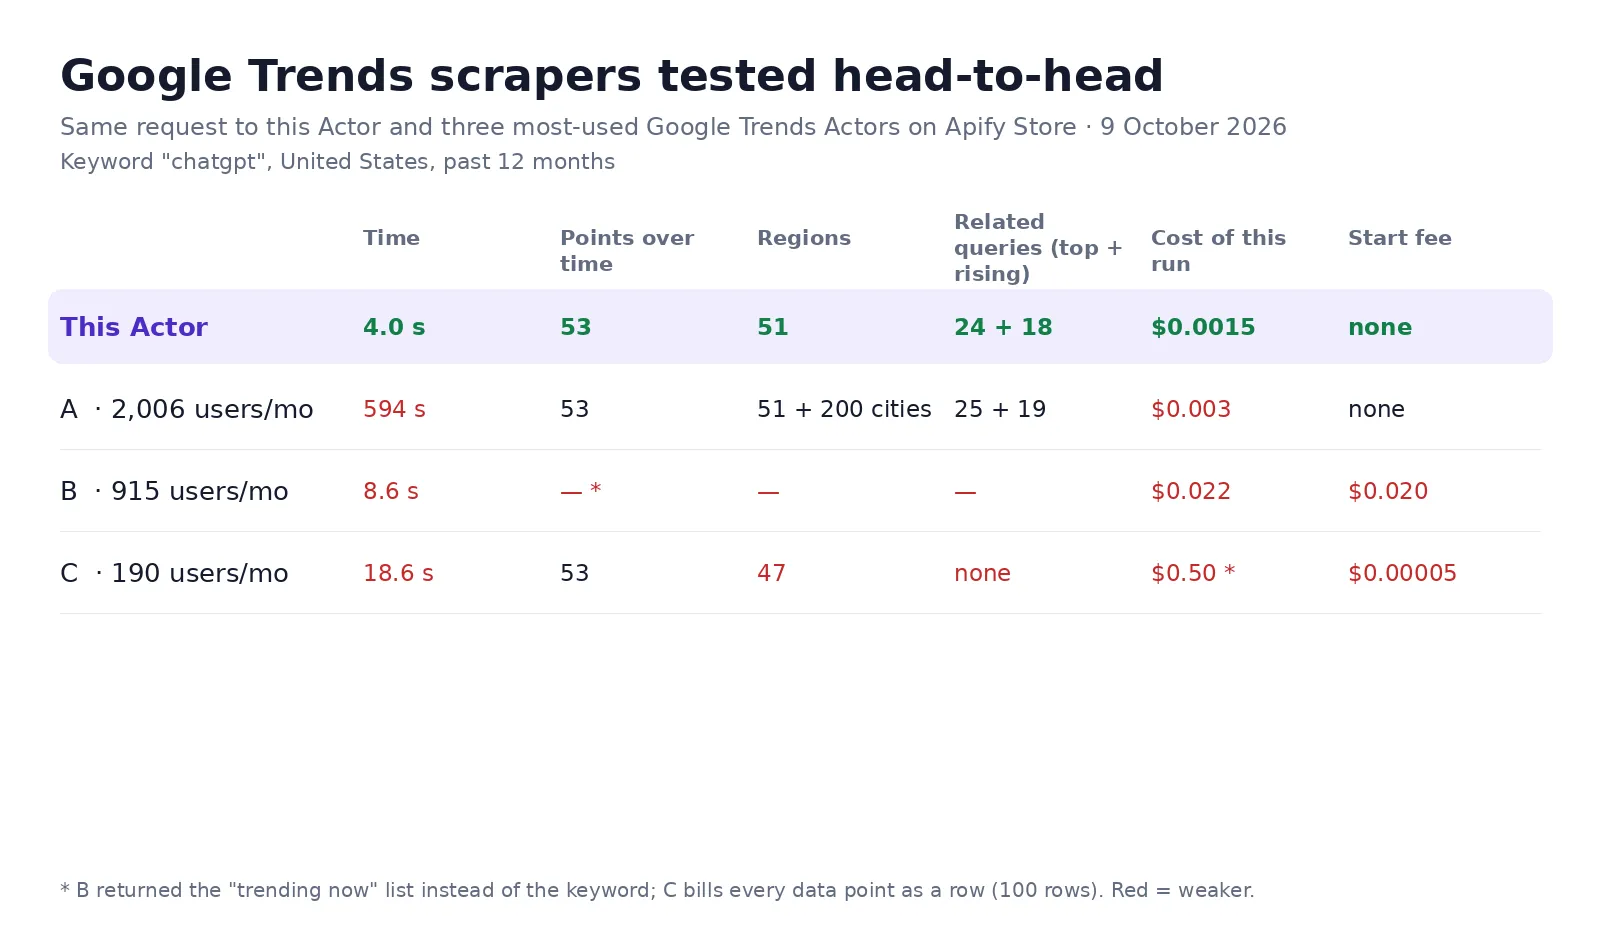
The same request went to this Actor and to the three most-used Google Trends Actors on the Apify Store (A–C by users in the last 30 days): the keyword "chatgpt", United States, past 12 months.
| This Actor | The three others | |
|---|---|---|
| Time | 4.0 s | 8.6–594 s |
| Interest over time | 53 weekly points | 53 for two of them; one returned the "trending now" list instead of the keyword |
| Interest by region | 51 states | 47 and 51 (+200 cities) |
| Related queries, top + rising | 24 + 18 | 25 + 19 for one, none for the others |
| Cost of this run | $0.0015 — one keyword report | $0.003–0.50 (one bills every data point as a row) |
What is Google Trends Scraper?
Google Trends shows how search interest changes, but has no official API and exports one chart at a time. This Actor calls the same data endpoints the Trends website uses and returns everything for a keyword in one row — for market research, SEO and content planning, product demand checks, seasonality, and AI agents that need to know "is this growing?".
What is in every row
| Field | Meaning |
|---|---|
interestOverTime | Every point of the chart: date, periodStart, periodEnd (exclusive, UTC), label, value (0–100), hasData, isPartial. When Google marks a period hasData:false the value is null with valueAbsentReason (Google itself sends a placeholder 0 there) |
window | The original window: what you asked (requested), what Google resolved (resolved, e.g. 2021-11-09 2026-11-09), granularity (month / week / day / hour / 8-minute / minute), first and last period, number of points, partial, no-data and zero points |
terms | Each term with termType keyword or topic, topicId and Google's topicName / topicType |
comparison | For comparisons: group number, terms in the group, the anchor term |
dataStatus, noDataReason | ok, no_data (Google shows nothing below its volume threshold — not proof of zero interest) or refused |
normalization | What the 0–100 scale is relative to, and that rows are not comparable by number |
provenance | source, officialApi:false, request (terms, geo, time range, resolved window, resolution, category, search type, hl, tz), parserVersion, schemaVersion, collectedAt, observedAt, sourceRecordId, canonicalUrl (the same chart on trends.google.com), checksum (SHA-256 of the data in the row) |
averageInterest, peakDate, trendDirection | Ready summary |
interestByRegion | Countries or regions with their interest (0–100) |
relatedQueries | Top and rising, with Google's values ("Breakout" = +5000%) |
relatedTopics, relatedTopicsStatus, relatedTopicsCoverage | Google withholds related topics from every automated client (see FAQ): by default the value is null and the status says withheld_by_google_for_automated_clients, never an empty "no topics" list. With Related topics — fetch from the rendered page on, the rising topics from Google's page arrive with ok_from_rendered_page, and relatedTopicsCoverage shows how many of Google's total you got |
keyword, geo, timeRange, category, property | What was asked |
Trending rows: title, approxTraffic, publishedAt, news | With Trending Now countries |
How much does it cost?
| Event | Price |
|---|---|
| Keyword report (or comparison of up to 5) | $0.0015 |
| Trending Now search | $0.0005 |
- Interest by region and related queries/topics are included.
- Every extra time window (History + fresh tail, or your own list) is its own Google export and costs one keyword report — e.g. one keyword with History + fresh tail = 4 reports = $0.006.
- Stitched and anchored rows (re-calibration) are free.
- Keywords that fail after retries: $0 (an error row says why).
Bulk export: what 50,000 rows actually cost
This Actor is built for bulk jobs — hundreds of inputs in one run, or a daily schedule. There is no fee per run, no fee per page and no proxy charge: you pay for the rows you keep.
| Job | This Actor | Most-used Actor in this category |
|---|---|---|
| 10,000 keyword reports | $15 | $30 |
| 50,000 keyword reports | $75 | $150 |
Checked on the Apify Store on 23 September 2026 against the Actor with the most monthly users in this category ($0.003 per dataset item). Some Actors here ask less per row — this table compares against the one buyers actually use most.
How to use it in three steps
- Type keywords — one per line. Switch on Compare to put up to 5 on one chart.
- Pick Country / region, Time range, Category and Search type (web, YouTube, news, images, shopping).
- Press Start, then download JSON, CSV or Excel — or call the run from the API, n8n, Make, Zapier or an AI agent.
History windows, stitching and comparing more than 5 terms
Google scales every export to 0–100 against the peak of that window, place, category, search type and set of terms. Two exports can't be glued by their numbers, and the Actor never does that silently:
- Original windows are always kept. With History + fresh tail a keyword gets its main report plus three
windowrows:today 5-y(weekly, ~261 points ≈ 5 years),today 3-m(daily, ~90 points) andnow 7-d(hourly, ~168 points). Add any other window in Extra time windows (today 1-m,now 1-dfor 8-minute points,2024-01-01 2024-06-30, …). - Stitched series (optional, free row
type: "stitched") — algorithmgt-overlap-median-ratioversion 1.0.0: windows are sorted longest first; the longest is the reference (factor 1). Each next window is calibrated against the finest already-calibrated window it overlaps: for every complete, non-partial, non-zero coarse period (e.g. a week) the finer points that fill it completely (its 7 days) are averaged, and the ratio reference value / window value is taken. The factor is the median of those ratios;pairsandrelativeSpread(median absolute deviation / factor) show how solid it is. Fewer than 3 pairs → the window isfailedwith a reason and is not scaled. The series uses the coarse window up to the first coarse boundary inside a finer window, then the finer one; each point keepssourceWindow,rawValue(Google's number) andfactor. Stitched values are on the reference scale and can exceed 100. - Common anchor (comparison of more than 5 terms) — algorithm
gt-common-anchor-ratioversion 1.0.0: with Compare keywords and Common anchor term, terms go 4 per Google chart plus the anchor; every group stays as its owncomparisonrow, and a freecomparison_anchoredrow scales group g by Σ anchor(group 0) / Σ anchor(group g) over complete periods. A group where the anchor averages under 5 gets a warning (rounding error is large). - Both algorithms are unit-tested (
node --test test/in the source: synthetic search volume → Google-style rounded windows → recovered ratios within 5–8 %, refusal without overlap, zeros and partial points ignored, anchor with zero overlap refused).
A 0 on a Google chart means "below Google's reporting threshold relative to this window's peak" — for a rare term it is
not proof that nobody searched. A period Google itself flags as having no data comes back as null.
⬇️ Input
⬆️ Output
Keyword report (trimmed — the real row has every week and every country):
Trending Now row:
Use cases
Market and product research
Is demand for a product, service or destination growing — and where?
SEO and content planning
Rising related queries are tomorrow's keywords.
Seasonality
Five years of weekly interest to plan campaigns and stock.
AI agents
"Is interest in X growing in Indonesia?" answered with data through the Apify MCP server.
Integrations
Every run is available through the Apify API, and the Actor works out of the box with n8n, Make, Zapier, Google Sheets, LangChain and the Apify MCP server.
FAQ
Are the values search volumes? No — Google Trends gives relative interest (0–100, where 100 is the peak in the chosen place and time). Terms inside one comparison share one scale; different rows do not (use the stitched or anchored rows, which say which algorithm and version produced them).
Is this the official Google Trends API? No. Google's official Trends API is in alpha and invite-only. This Actor reads the public JSON the Trends website itself loads (provenance.officialApi: false).
Related topics — Google withholds them from API clients (USER_TYPE_SCRAPER) but still renders them on the page. Turn on Related topics — fetch from the rendered page (topicsViaGoogle) and the Actor fetches that rendered page per keyword (in a comparison — per compared term), so relatedTopics arrives with relatedTopicsStatus: ok_from_rendered_page: the rising topics the page shows (usually 5, each with entity id /m/… or /g/… and +% or Breakout). relatedTopicsCoverage tells you how many topics Google has in total (e.g. 5 of 24) — the rest and the Top list are only shown after clicks on Google's page, so they are not delivered. The page is fetched in parallel with the report and retried up to 3 times if it fails; you pay one related-topics event per term only when topics actually arrived. If Google shows "not enough data" for the keyword, the status says not_enough_data_on_google (not charged); if the page could not be fetched after 3 attempts, rendered_page_unavailable_try_again (not charged).
Without that option: Google's website sends a reCAPTCHA v3 token with each request and Google labels the request USER_TYPE_LEGIT_USER; every automated request is labelled USER_TYPE_SCRAPER, and for those Google returns the related-topics list empty while queries, timeline and regions stay complete. We do not forge that token, so the Actor tells you the topics were withheld (relatedTopicsStatus, provenance.googleUserType) instead of pretending there are none. (Google's rate-limit page — “Error 429”, “unusual traffic” — carries no captcha at all; when it appears the Actor counts it (http.blocked), pauses and moves to a residential address, and if a page ever does carry a real reCAPTCHA it is solved once through Capsolver and retried.) If Google ever sends them, they appear with mid, title and type.
Why do some keywords have empty related queries or no points at all? Google shows them only when there is enough search volume. An empty chart comes back with dataStatus: "no_data" — that is not proof of zero interest.
Can I use a topic instead of a search term? Yes — put the topic ID (/m/027lnzs for iPhone, /g/…) in Keywords. A topic counts all searches about the entity in any language; terms[].topicName shows Google's name for it.
What does "Breakout" mean? A rising query that grew by more than 5000%.
Google Trends refused a request? Google limits bursts. The Actor retries on fresh addresses; keywords that still fail are free — run them again a few minutes later.
Is this legal? The Actor reads public, aggregated Google Trends data. No personal data is involved.


