

TikTok Shop Top Products: Revenue, Units & Video/LIVE Split
Pricing
from $1.60 / 1,000 products
TikTok Shop Top Products: Revenue, Units & Video/LIVE Split
Rank TikTok Shop best sellers by revenue or units sold in 15 markets: a whole market, category, search term, shop, creator or past month. Each row has revenue split into video, LIVE and shop window, 30-day growth, commission, creator counts and 1-90 day sales, in USD. JSON, CSV or API.
Pricing
from $1.60 / 1,000 products
Rating
0.0
(0)
Developer

Muhamed Didovic
Maintained by CommunityActor stats
0
Bookmarked
16
Total users
4
Monthly active users
4 hours ago
Last modified
Categories
Features
Share
See what sells on TikTok Shop, and how. Rank the best-selling products of any of 15 TikTok Shop markets by revenue or units sold, for a whole market, a category, a search term, a shop, a creator or a past month.
Every product row carries the period's revenue and units, the split between videos, LIVE streams and the shop window, 30-day growth, the commission creators earn, and how many creators, videos and LIVEs sell it. Amounts are in US dollars in every market.
Product research for the money, not the catalogue.
Why Use This Scraper?
- Ranked by money. Ask for the top of a market or category by revenue, units sold or price, instead of collecting products you already know about.
- Where the sales come from. Revenue split into videos, LIVE streams and the shop window (the shop's own page and search) on every row.
- Momentum on every row. Last 30 days against the 30 before, a 7-day rising/stable/falling signal, and units and revenue for 1, 7, 30 and 90 days and lifetime.
- Creator economics included. Commission offered to creators and the number of creators, videos and LIVE streams promoting the product, in the same row at the same price.
- 15 markets, one currency. United States, United Kingdom, Germany, France, Italy, Spain, Brazil, Japan, Mexico, Indonesia, Thailand, Vietnam, Philippines, Malaysia and Singapore, all in USD.
- Past months. Rank October's best sellers against September's.
- Clean rankings. Affiliate samples, "not for sale" gifts and live-auction slots with placeholder prices are left out by default, and counted in the run summary.
- Pay for rows, not inputs. $2.00 per 1,000 products on the Bronze plan (down to $1.60 on Gold and up) plus $0.01 a run. No minimum per input, and nothing skipped is charged.
Overview
This actor is for people deciding what to sell, stock, promote or invest in on TikTok Shop: dropshippers and private-label sellers, brands watching their category, affiliate creators choosing what to push, agencies preparing client reports, and analysts sizing markets across countries.
You choose a market and what to rank. The actor returns one flat row per product, ranked within each input, with the money figures attached. Several inputs can run in one go; each keeps its own ranking, and a product found by two inputs is delivered once.
The dataset exports as JSON, CSV, Excel or through the API. A RUN_SUMMARY record in the run's key-value store lists what each input delivered and what it skipped.
Supported Inputs
| What you give | What you get |
|---|---|
| Nothing (all inputs empty) | The top products of the whole market |
A category name, e.g. Beauty & Personal Care, Health, Household Appliances, or a numeric category id | The top products of that category |
A search term, e.g. air fryer, lip oil, creatine | Products whose title contains every word of the term, ranked |
A shop id or store link, e.g. https://www.tiktok.com/shop/store/goli-nutrition/7495794203056835079 | That shop's products, ranked |
A creator: @dealswithty, https://www.tiktok.com/@dealswithty or a numeric user id | The products that creator promotes, ranked |
A finished month, e.g. 2026-10 (with the market or categories) | That month's best sellers by units sold |
Categories available by name: Beauty & Personal Care, Health, Household Appliances, Home Supplies, Kitchenware, Womenswear & Underwear, Menswear & Underwear, Phones & Electronics, Sports & Outdoor, Toys & Hobbies, Pet Supplies, Baby & Maternity, Food & Beverages, Fashion Accessories, Textiles & Soft Furnishings, Automotive & Motorcycle, Tools & Hardware, Home Improvement, Computers & Office Equipment, Luggage & Bags, Shoes, Furniture, Books Magazines & Audio, Kids' Fashion, Jewelry Accessories & Derivatives, Collectibles, Pre-Owned, Muslim Fashion.
Not supported: single product links (use TikTok Shop Scraper for a product's page with SKUs and reviews), subcategory names (pass the numeric id instead), and markets outside the 15 above.
Use Cases
| Who | What they do with it |
|---|---|
| Dropshippers and sellers | Find products with rising revenue in a category before they saturate |
| Brands | Benchmark their products and competitors' within a category and month |
| Affiliate creators | Pick products with high commission and few creators selling them |
| Agencies | Build monthly category reports for clients, across markets |
| Live sellers | Find which products sell through LIVE rather than videos |
| Analysts and investors | Size categories and compare markets in one currency |
How It Works
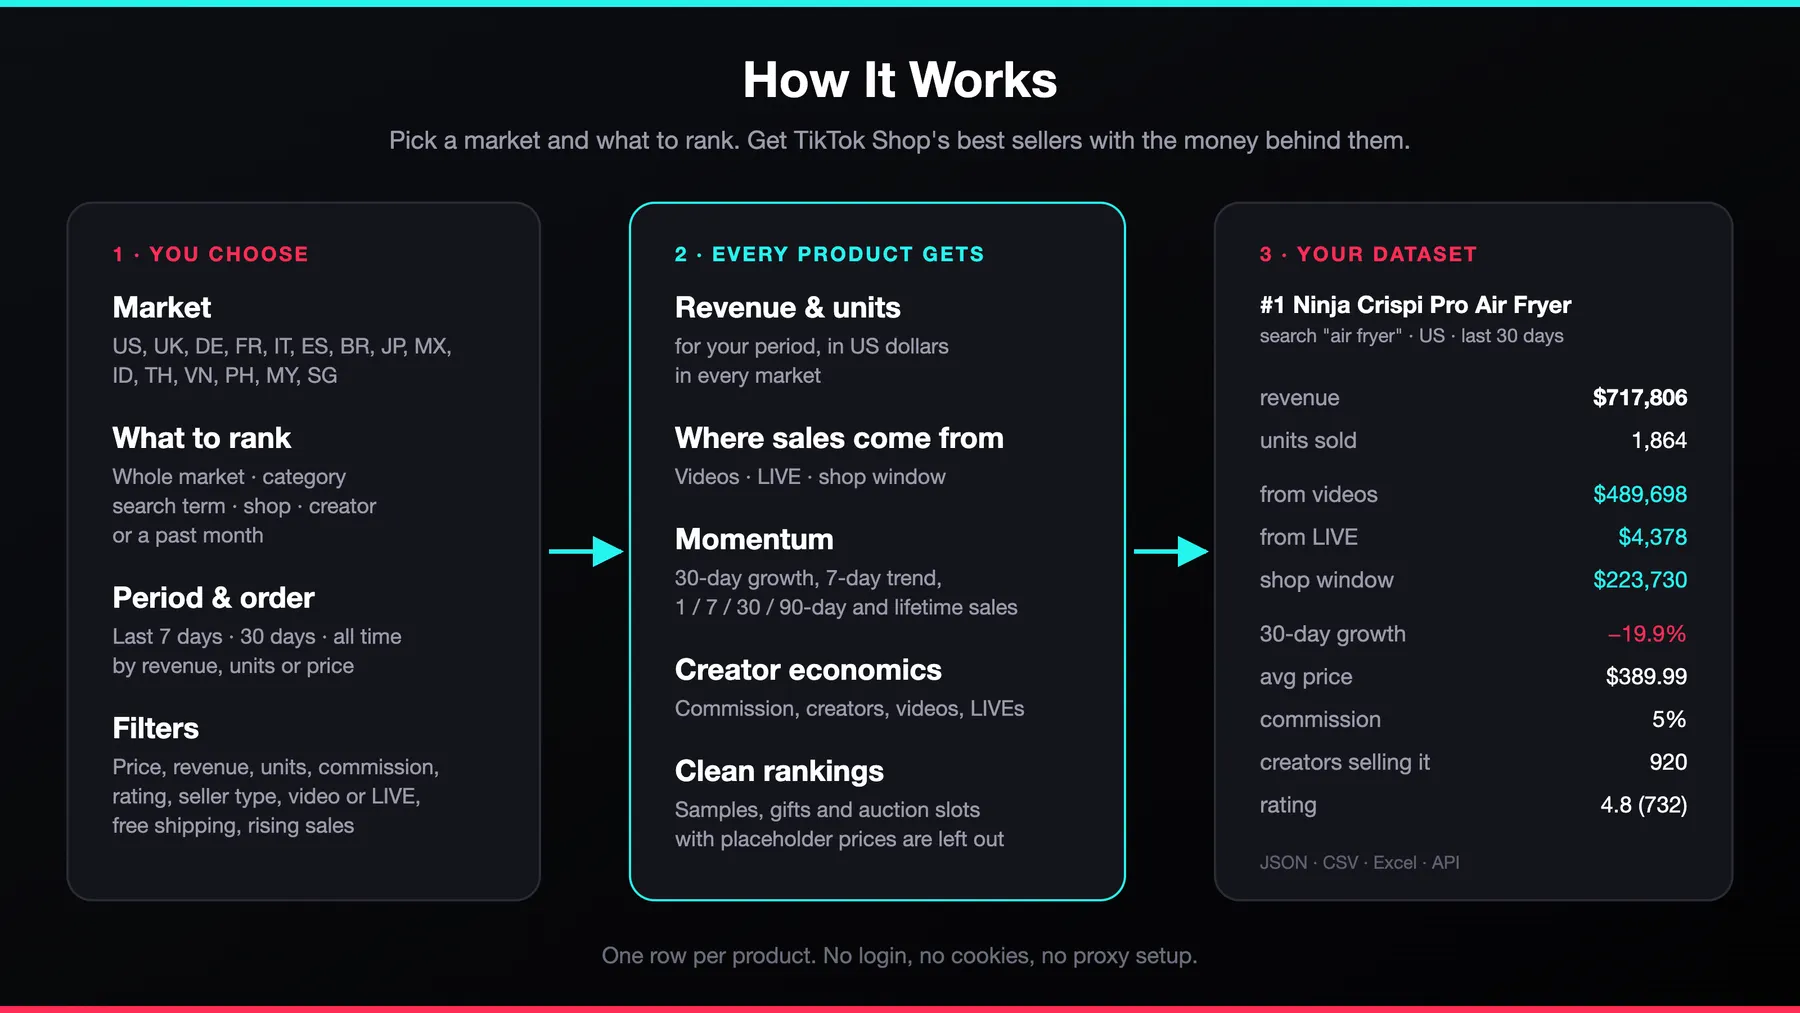
- Pick a market from the 15 TikTok Shop countries.
- Say what to rank: the whole market, categories, search terms, shops, creators, or a finished month.
- Choose the period and order: last 7 days, last 30 days or all time, by revenue, units sold or price, plus any filters.
- The actor ranks each input, skips placeholder listings and anything outside your filters, and delivers up to your limit per input.
- Export the dataset as JSON, CSV or Excel, or read it through the API.
Input Configuration
| Field | Type | Default | Description |
|---|---|---|---|
market | string | US | TikTok Shop country: US, GB, DE, FR, IT, ES, BR, JP, MX, ID, TH, VN, PH, MY, SG. |
period | string | last30Days | lastDay, last7Days, last30Days or allTime: the window for revenue and units. |
sortBy | string | revenue | revenue, unitsSold or price, highest first. |
searchTerms | array | none | Search terms. |
categories | array | none | Category names or numeric category ids. |
shops | array | none | Shop ids or store links. |
creators | array | none | @username, profile links or numeric user ids. |
pastMonth | string | none | A finished month as YYYY-MM. Ranks the market or the categories by that month's units sold. |
maxProductsPerSource | integer | 50 | Products per input, 1 to 500. |
minPrice / maxPrice | integer | none | Average selling price, USD. |
minRevenue / minUnitsSold | integer | none | Within the sales period. |
minCommissionPercent | integer | none | Creator commission the seller offers, 0 to 100. |
minRating | integer | none | 1 to 5. |
sellerType | string | any | any, local or crossBorder. |
mainChannel | string | any | any, video or live: the channel a product mainly sells through. |
freeShippingOnly | boolean | false | Only products with free shipping. |
risingOnly | boolean | false | Only products whose sales rose over the last 7 days. |
includeSuspectedPlaceholders | boolean | false | Keep placeholder listings, marked with suspectReason. |
salesHistory | string | off | 7, 30 or 90: add the product's daily units and revenue for that many days. Paid plans only, from 3 December 2026. |
Top 50 of a category, last 7 days
Search terms in the UK, at least 15% commission
What a creator sells, and a shop's best sellers
October's best sellers in Indonesia
Output Overview
One flat row per product. Each row says where it came from (source, sourceInput) and its position in that input's ranking (rank), then carries:
- the period's money:
unitsSold,revenue, and its splitvideoRevenue,liveRevenue,shopWindowRevenue - momentum:
revenueGrowth30dPercent,salesTrend7d, and every window from 1 day to lifetime - price and creator economics:
avgPrice,minPrice,maxPrice,localPrice,commissionPercent,creatorCount,videoCount,liveCount - product facts:
title,productUrl,imageUrl,rating,reviewCount,freeShipping,sellerType, shop and category
Rows from a pastMonth ranking carry that month's unitsSold and revenue, and no video/LIVE split.
Output Samples
A real row from a run on 14 November 2026 (search term air fryer, US, last 30 days), shortened:
A row from a pastMonth ranking (Health, US, October 2026), shortened:
Key Output Fields
Ranking
| Field | Meaning |
|---|---|
rank | Position within the input's ranking. |
source, sourceInput | market, category, search, shop, creator (with the month for past-month rankings), and the input that found the product. |
period | lastDay, last7Days, last30Days, allTime, or the month. |
Sales
| Field | Meaning |
|---|---|
unitsSold, revenue | Units and revenue (USD) in the period. |
videoRevenue, liveRevenue, shopWindowRevenue | Where the period's revenue came from. |
videoUnitsSold, liveUnitsSold | Units sold through videos and through LIVE. |
revenueGrowth30dPercent | Revenue of the last 30 days against the 30 before. |
salesTrend7d | rising, stable or falling over the last 7 days. |
unitsSold1d / 7d / 30d / 90d / Total, revenue1d … revenueTotal | Every window, whatever the period. |
Price and creators
| Field | Meaning |
|---|---|
avgPrice, minPrice, maxPrice | USD. |
localPrice, localCurrency | The price as the shop lists it, in its own currency. |
commissionPercent | Affiliate commission offered to creators. |
creatorCount, videoCount, liveCount, videoViews30d | How widely the product is promoted. |
Product, shop and category
| Field | Meaning |
|---|---|
productId, title, productUrl, imageUrl, market | The product. |
rating, reviewCount, freeShipping, fullyManaged, sellerType | Listing facts. |
shopId, shopUrl | The shop selling it. |
categoryId, categoryName, subcategoryIds | Category. |
firstSeenDate, dataDate | When the product first appeared in the sales data, and the day the figures are from. |
suspectReason | Only with includeSuspectedPlaceholders: why a listing looks like a placeholder. |
salesHistory | Only with salesHistory on: one entry per day, oldest first, with date, unitsSold, revenue, totalUnitsSold, totalRevenue, avgPrice, creators, videos and lives. The newest day is usually a few days back. |
FAQ
How fresh is the data? Sales figures are refreshed daily, so a run shows sales up to the previous day.
Are the revenue figures exact?
They are estimates built from TikTok Shop sales data, the kind product-research dashboards show. Units sold matched TikTok's own sold counts within 1–2% in our checks. A few products with unusual SKU pricing can show a high revenue per unit; compare revenue / unitsSold with avgPrice if a figure looks off.
Why does it skip some listings?
Sellers list affiliate samples, gifts marked "not for sale" and live-auction slots with placeholder prices. Their revenue is not real, yet it tops revenue rankings in several markets (on 14 November 2026, all five top Indonesian products by revenue were such listings). They are skipped and counted in RUN_SUMMARY. Turn on includeSuspectedPlaceholders to keep them.
Why does an air fryer search include a cookbook?
A product is kept when its title contains every word of the term, so accessories and recipe books that name the product can appear. Sort or filter by categoryName to keep one category.
Does pastMonth work with search terms, shops or creators?
No. It ranks the whole market or the categories you give. Search terms, shops and creators in the same run use period.
Can I get more than 500 products per input?
maxProductsPerSource goes up to 500. For more, split the market into categories, or add filters such as price bands.
What is in the daily sales history?
Turn on salesHistory and each product gets one entry per day for the last 7, 30 or 90 days: units sold and revenue that day, the running totals, the average price, and how many creators, videos and lives were selling it. It shows whether a product is still climbing or already fading. It is charged per 10 days delivered, $0.003, and days with no data are not charged.
What does the free Apify plan get? Up to 20 products from the first input per run. Any paid Apify plan removes the limit.
How much does it cost?
| Free plan | Bronze | Silver | Gold and up | |
|---|---|---|---|---|
| Per product row | $0.0025 | $0.0020 | $0.0018 | $0.0016 |
| Per run start | $0.01 | $0.01 | $0.01 | $0.01 |
| Daily sales history, per 10 days of one product | not available | $0.003 | $0.003 | $0.003 |
A run of 3 search terms with 10 products each costs $0.07 on Bronze. Placeholder listings, filtered-out products, duplicates and the run summary are never charged, and there is no minimum per input. Set "Max cost per run" in the run options and the run stops by itself at that amount, with every delivered row paid for.
Support
Found a bug or missing a field? Open an issue on the actor's Issues tab with your run link and input.
Additional Services
Need a scheduled category report, another export shape or a market this actor does not cover? Ask on the Issues tab; tailored work is available.
Explore More Scrapers
- TikTok Shop Scraper: product pages with SKUs, stock, sold count and reviews.
- TikTok Shop Creator Finder: affiliate creators with units sold and contact emails.
- TikTok Shop Videos: the videos that sell the most, with each video's revenue, views and products.
- TikTok Shop LIVE Sales: the livestreams that sell the most, with revenue, viewers and top products.
- TikTok Shop Sellers: shops ranked by revenue and units.
- TikTok Shop Sales Scraper: units sold and sales pace for products found by keyword.
- TikTok Scraper: profiles, videos, hashtags, search and comments.
- TikTok Creative Center Scraper: top ads, CTR and trends.
Full list at apify.com/memo23.
🤖 For AI Agents & LLM Apps
Compact reference for agents calling this actor through the Apify MCP server or the Apify API (actor: memo23/tiktok-shop-top-products).
Purpose: rank TikTok Shop products by revenue or units sold in one of 15 markets, for a market, category, search term, shop, creator or past month, with the video/LIVE/shop-window revenue split.
Minimal input:
Output: one row per product: productId, title, productUrl, imageUrl, market, rank, source, sourceInput, period, unitsSold, revenue, videoRevenue, liveRevenue, shopWindowRevenue, videoUnitsSold, liveUnitsSold, revenueGrowth30dPercent, salesTrend7d, avgPrice, minPrice, maxPrice, localPrice, localCurrency, commissionPercent, rating, reviewCount, creatorCount, videoCount, liveCount, videoViews30d, unitsSold1d/7d/30d/90d/Total, revenue1d/7d/30d/90d/Total, freeShipping, sellerType, fullyManaged, shopId, shopUrl, categoryId, categoryName, subcategoryIds, firstSeenDate, dataDate.
Behaviors an agent should know:
- All money is USD. Figures are daily estimates, not live.
- With no inputs, the whole market is ranked. Each input is ranked separately; duplicates across inputs are delivered once.
maxProductsPerSourcebounds each input (default 50, max 500), and so the cost.pastMonthapplies only to the market or categories, ranks by units, and leaves the video/LIVE split empty.- Billing: $0.01 per run start plus one
productcharge per delivered row ($0.002 on Bronze). Skipped placeholders, filtered rows, duplicates andRUN_SUMMARYare free. WithsalesHistoryon, $0.003 per 10 days of history per product. - An input that returns nothing is listed with its reason in the
RUN_SUMMARYkey-value record.
⚠️ Disclaimer
This Actor is an independent tool and is not affiliated with, endorsed by, or sponsored by ByteDance Ltd., TikTok or any of their subsidiaries. All trademarks mentioned are the property of their respective owners.
It returns publicly available commercial information about products listed on TikTok Shop, with sales figures that are estimates. It does not access accounts, private data or content behind a login. Users are responsible for making sure their use complies with TikTok's Terms of Service, applicable data-protection law (GDPR, CCPA and similar) and their own contractual obligations.
SEO Keywords
tiktok shop top products, tiktok shop best sellers, tiktok shop best selling products, tiktok shop gmv, tiktok shop revenue data, tiktok shop sales data, tiktok shop product research, tiktok shop winning products, tiktok shop trending products, tiktok shop analytics, tiktok shop live sales, tiktok shop video sales, tiktok shop affiliate commission, tiktok shop creator products, dropshipping product research tiktok, tiktok made me buy it products, tiktok shop uk best sellers, tiktok shop indonesia best sellers, tiktok shop thailand, tiktok shop vietnam, tiktok shop philippines, tiktok shop malaysia, tiktok shop mexico, tiktok shop germany


