

US Market Regime Panel: Yield Curve, VIX & Skew Daily
Pricing
from $1.00 / 1,000 trading day returneds
US Market Regime Panel: Yield Curve, VIX & Skew Daily
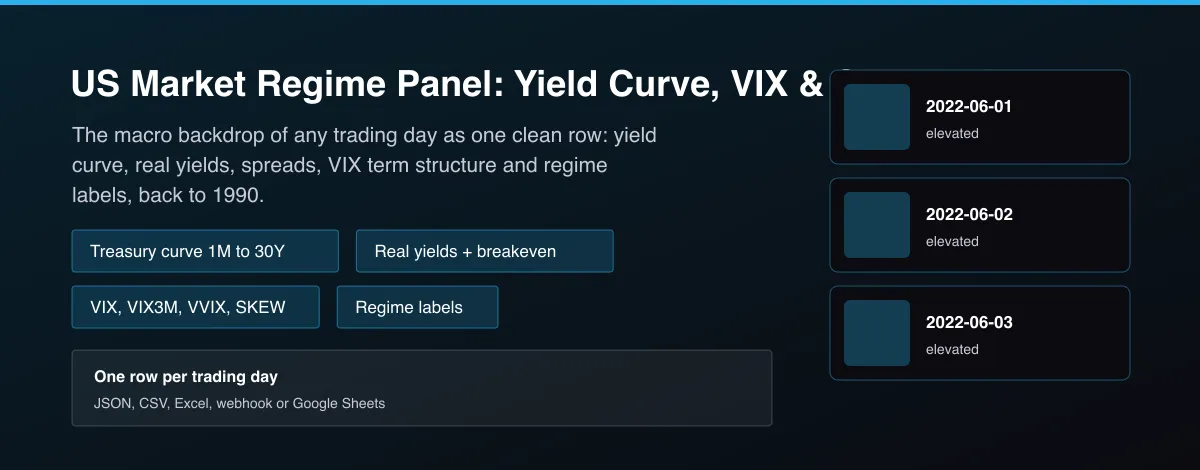
Daily US rates and volatility features in one table: Treasury yield curve, real yields, breakeven, 2s10s and 3m10y spreads, VIX term structure, VVIX, SKEW, 1-year VIX percentile and regime labels. Ready to join to prices.

What does US Market Regime Panel: Yield Curve, VIX & Skew Daily do?
US Market Regime Panel returns one row per US trading day with the rates and volatility backdrop that market predictors, macro dashboards and risk models need. Each row holds the Treasury nominal yield curve from 1 month to 30 years, real yields and the 10-year breakeven inflation rate, the 2s10s, 3m10y and 5s30s spreads in basis points with a curve regime label, daily yield changes, the VIX, VIX9D, VIX3M, VIX6M, VVIX and SKEW indices, VIX term-structure ratios, the VIX 1-year percentile and a volatility regime label. History reaches back to 1990 for the curve and to the start of each index series. All inputs are published by the US Treasury and Cboe.
Why use US Market Regime Panel: Yield Curve, VIX & Skew Daily?
- Ready to join: one row per date, so it merges with any price or return series on the date.
- Derived features included: spreads, breakeven, term-structure ratios, percentiles and regime labels.
- Official sources: US Treasury par yield and real yield curves and Cboe index histories.
- Point-in-time friendly: each day's values are the ones published for that day.
- Bulk history in one run, or a daily delta of only the new day. No API key or login.
What makes this different
Macro features usually mean stitching Treasury CSVs and several Cboe index files together and writing your own spreads and percentiles. This Actor does the join and the maths once, with consistent dates and blanks where a series does not exist, so your model gets the backdrop in one table.
Who can use the US Market Regime Panel and how?
- Quant researchers and predictors: add rates and volatility regime features to price and return models.
- Portfolio managers: monitor curve inversion and volatility regimes across time.
- Risk teams: stress-test with VIX percentiles, term structure and skew.
- Economists and students: study the yield curve, breakeven inflation and volatility together.
- Newsletter writers: publish a daily macro dashboard.
- Fintech apps: show the market backdrop next to a portfolio.
- AI agent builders: let an assistant answer what the yield curve and VIX look like today.
- Backtesting platforms: filter historical signals by regime.
How it works
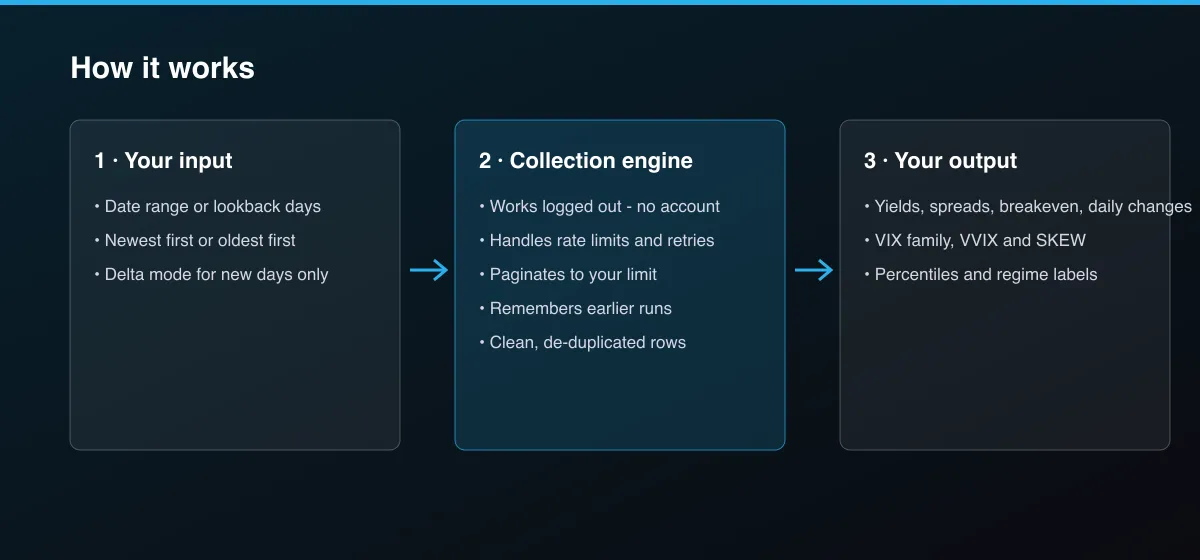
- Your input — set a date range or a lookback in days.
- The Actor collects it — the Actor reads the Treasury and Cboe histories and joins them by date.
- Your output — you get one row per trading day with derived features; schedule it daily with delta mode to append each new day.
What data can you extract?
The dataset has 43 fields per row:
| Field | Type | Description |
|---|---|---|
date | string | Trading date, YYYY-MM-DD. |
y_1m | number | 1-month Treasury par yield, percent. |
y_2m | number | 2-month Treasury par yield, percent. |
y_3m | number | 3-month Treasury par yield, percent. |
y_4m | number | 4-month Treasury par yield, percent. |
y_6m | number | 6-month Treasury par yield, percent. |
y_1y | number | 1-year Treasury par yield, percent. |
y_2y | number | 2-year Treasury par yield, percent. |
y_3y | number | 3-year Treasury par yield, percent. |
y_5y | number | 5-year Treasury par yield, percent. |
y_7y | number | 7-year Treasury par yield, percent. |
y_10y | number | 10-year Treasury par yield, percent. |
y_20y | number | 20-year Treasury par yield, percent. |
y_30y | number | 30-year Treasury par yield, percent. |
real_5y | number | 5y real yield, percent. |
real_7y | number | 7y real yield, percent. |
real_10y | number | 10y real yield, percent. |
real_20y | number | 20y real yield, percent. |
real_30y | number | 30y real yield, percent. |
breakeven_10y | number | 10-year nominal minus real yield, percent. |
spread_2s10s_bps | number | 10y minus 2y yield, basis points. |
spread_3m10y_bps | number | 10y minus 3m yield, basis points. |
spread_5s30s_bps | number | 30y minus 5y yield, basis points. |
curve_regime | string | inverted, flat or normal. |
change_10y_bps | number | 1-day change in the 10y yield, bps. |
change_2y_bps | number | 1-day change in the 2y yield, bps. |
vix | number | VIX close. |
vix9d | number | VIX9D close. |
vix3m | number | VIX3M close. |
vix6m | number | VIX6M close. |
vvix | number | VVIX close. |
skew_index | number | Cboe SKEW index close. |
vix_to_vix3m | number | VIX divided by VIX3M. |
vix9d_to_vix | number | VIX9D divided by VIX. |
vol_term_structure | string | contango or backwardation. |
vix_regime | string | low, normal, elevated or stress. |
vix_percentile_1y | number | Percentile of VIX over the last 252 trading days. |
vix_change_1d | number | 1-day VIX change. |
vix_change_5d | number | 5-day VIX change. |
fetch_path | string | How the data was obtained. |
source | string | Data source. |
scraped_at | string | Timestamp. |
actor_version | string | Actor version. |
How to use US Market Regime Panel: Yield Curve, VIX & Skew Daily
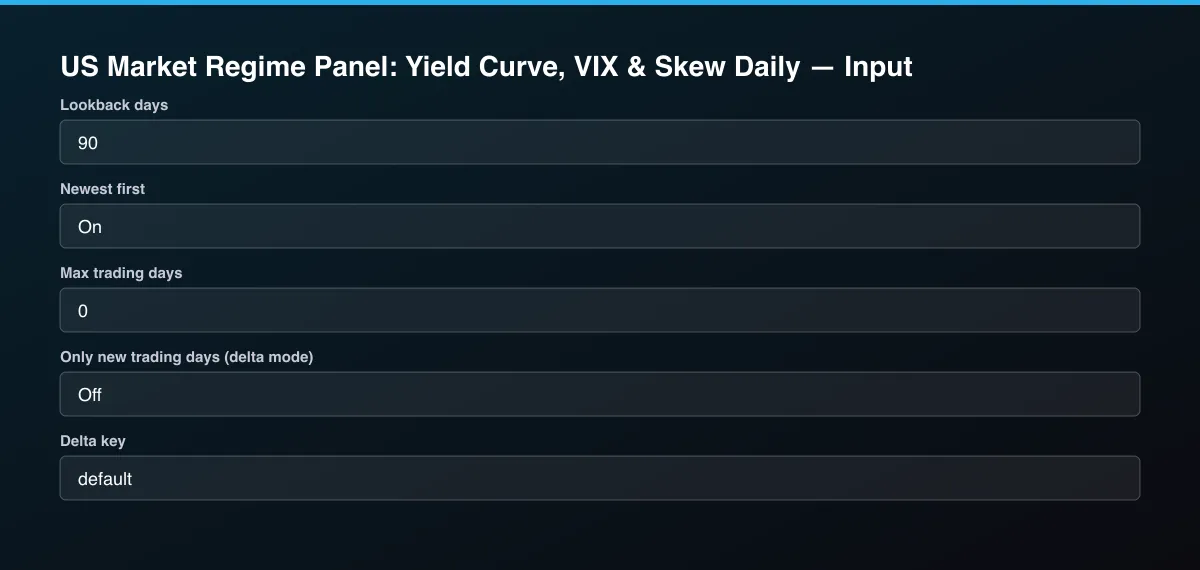
- Open the Actor and go to the Input tab.
- Leave the dates empty for the last 90 days, or set Start date and End date (for example 2000-01-01 to today) for a long history. Turn on Only new trading days (delta mode) and schedule the Actor after the US close to append each new day.
- Optionally set filters and a Max results limit.
- Click Start. A default run finishes in under a minute.
- Open the Output tab, then download the dataset or connect it to your tools.
Input Parameters
| Parameter | Type | Required | Default | Description |
|---|---|---|---|---|
startDate | string | No | — | First trading date, YYYY-MM-DD. Leave empty to use the lookback below. |
endDate | string | No | — | Last trading date, YYYY-MM-DD. Leave empty for today. |
lookbackDays | integer | No | 90 | Used when no start date is set. |
newestFirst | boolean | No | true | Return the newest trading day first. Turn off for chronological order. |
maxItems | integer | No | 0 | Cap on returned days. Set 0 for no limit. |
deltaMode | boolean | No | false | After the first run with a delta key, return and bill only trading days not delivered before. |
deltaStateKey | string | No | "default" | Name of the tracked stream. |
proxyConfiguration | object | No | {"useApifyProxy":false} | Optional proxy. The sources work without one. |
Output Data
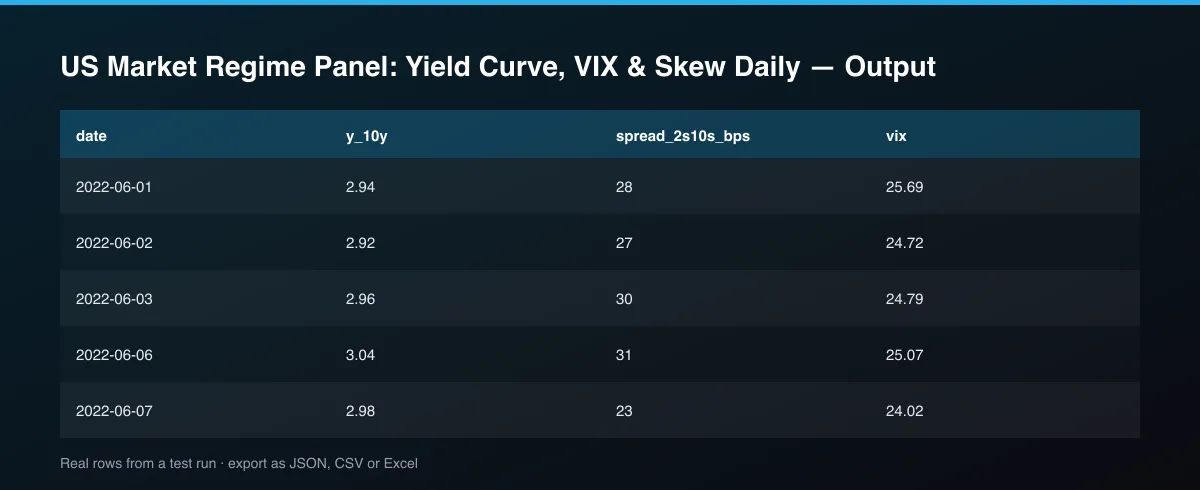
y_* are Treasury par yields in percent, real_* are real yields, breakeven_10y is the 10-year nominal minus real yield. spread_*_bps are yield differences in basis points and curve_regime is inverted (2s10s below 0), flat (below 25 bps) or normal. vix_to_vix3m above 1 (vol_term_structure backwardation) means near-term fear exceeds three-month fear. vix_percentile_1y is the share of the last 252 trading days at or below today's VIX. vix_regime is low (<15), normal, elevated (20-30) or stress (>30).
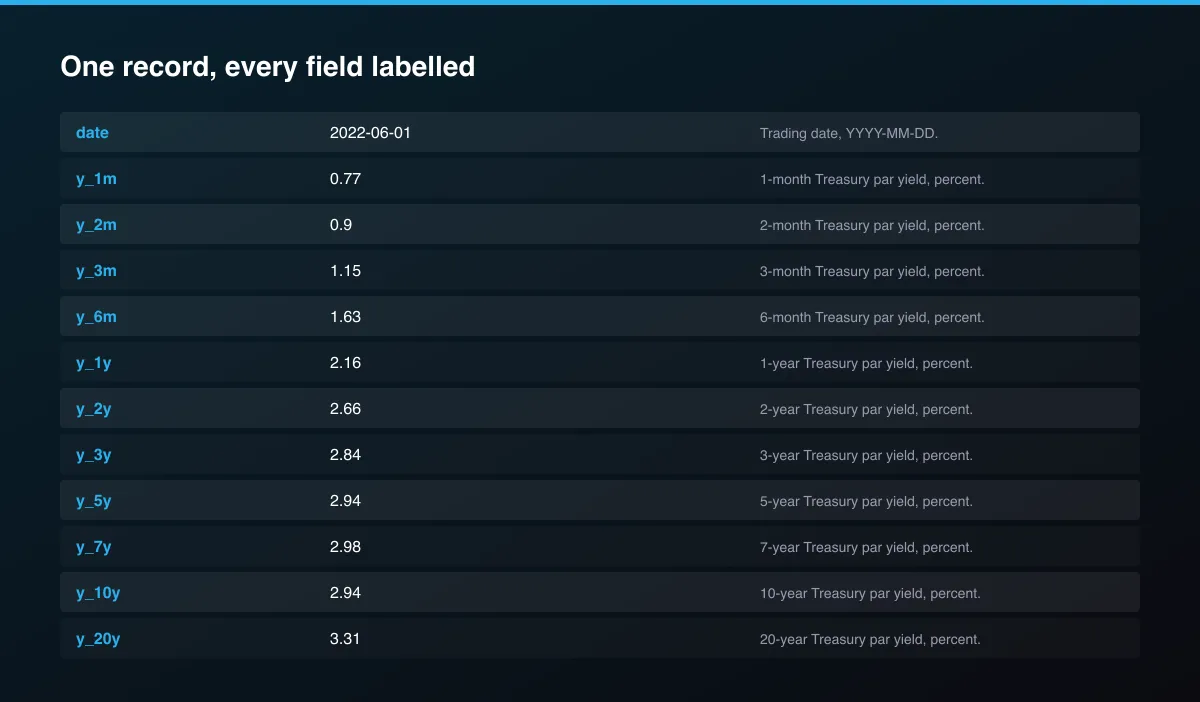
A real dataset item:
How to read and use the results
- Read curve_regime and spread_2s10s_bps for the slope of the curve.
- Check vol_term_structure and vix_to_vix3m: backwardation signals near-term stress.
- Use vix_percentile_1y to compare today's volatility with the past year.
- Read breakeven_10y for inflation expectations.
- Join on date to your own price data.
- Schedule with delta mode to append each new trading day.
Usage Examples
Last 90 days
Full history for a model
Only new days, for a daily schedule
Tips for Best Results
- Join on the date column; markets are closed on weekends and holidays, so those dates have no row.
- Real yields start in 2003 and VIX3M, VIX9D and VIX6M start later than the VIX; earlier values are empty.
- Use vix_percentile_1y rather than raw VIX levels to compare volatility across years.
- Yield-curve inversion is a slow signal; combine it with faster features such as the VIX term structure.
- Run it once for the whole history, then schedule daily with delta mode.
- Default is 5 results for a fast test. Set the max to 0 to return everything available.
Reliability by mode
| Mode | Status | Needs login or key? | Notes |
|---|---|---|---|
| Treasury nominal yields | ✅ | No | Published daily by the US Treasury. |
| Real yields and breakeven | ✅ | No | From 2003. |
| VIX, VVIX, SKEW histories | ✅ | No | Published by Cboe. |
| VIX9D, VIX3M, VIX6M | 🟡 | No | Start later than the VIX. |
| Intraday or real-time values | ❌ | - | End-of-day only. |
✅ works as described, 🟡 works with caveats, ❌ not supported.
Only new records (delta mode)
Turn on Only new trading days (delta mode) and set a Delta key. The first run returns the whole range; later runs return, and bill, only trading days not delivered before.
Known Limitations
- Yields and index closes are end-of-day values published after the US close; the newest day can be missing until the sources update.
- Treasury yields are par yields, not tradable prices, and some maturities were introduced later (for example the 1.5-month) so earlier values are empty.
- The percentile uses the trailing 252 trading days and is empty until enough history exists.
- Regime labels use fixed, published thresholds and are descriptive, not forecasts.
- This is information, not financial advice.
Integrations
Run it from the Apify API, on a schedule, or from a webhook. Send results straight to Google Sheets, Make, Zapier, Slack or your own database with Apify's built-in integrations.
Export Formats
Download the dataset as JSON, CSV, Excel, XML, HTML table or RSS from the Output tab or the API.
Frequently Asked Questions
Where does the data come from?
The US Department of the Treasury's daily yield curve data and the Cboe Global Markets index histories, both public.
How far back does it go?
Treasury nominal yields from 1990, real yields from 2003, and each Cboe series from its own start.
Does it need an API key or account?
No.
Can I get intraday data?
No, the data is end-of-day.
Why is a value empty?
The series did not exist on that date, or the source has not published that day yet.
Am I charged for empty days?
No, only for trading days returned.
Do I need an account or login?
No. The Actor reads public Treasury and Cboe data and needs no account or API key.
Am I charged for failed runs or empty results?
You are only charged for results that are actually written to the dataset.
Can I run it on a schedule?
Yes. Create a Task with your input and add a schedule in Apify Console. With monitor mode on, each scheduled run returns only what changed since the previous one.
Changelog
- 2026-09-27: First release: Treasury curve, real yields, spreads, VIX family, VVIX, SKEW, percentiles and regime labels.
Enterprise and custom work
Need higher volumes, a custom output schema, dedicated scheduling or a no-breaking-changes commitment for a production pipeline? Open an issue on the Actor page and describe your use case. Bulk terms and custom builds are available.
Support
Questions or a missing field? Open an issue from the Issues tab on this Actor's page and it will be looked at.
Legal / Responsible Use
This Actor reads publicly published US Treasury and Cboe index data. You are responsible for how you use the data. It is not financial advice and not affiliated with the US Treasury or Cboe.


