

US Natural Gas Data API — EIA Prices, Storage & Production
Pricing
from $33.50 / 1,000 eia natural gas observations
US Natural Gas Data API — EIA Prices, Storage & Production
US natural gas statistics from EIA's official bulk file: Henry Hub and citygate prices, weekly storage, production, consumption, imports and exports by state and region. Filter by series, name, area and period. No API key. Part of NexGen Signal — official-source data products
Pricing
from $33.50 / 1,000 eia natural gas observations
Rating
0.0
(0)
Developer
NexGen Signal
Maintained by CommunityActor stats
0
Bookmarked
2
Total users
1
Monthly active users
10 days ago
Last modified
Categories
Share
🔥 US Natural Gas Data API — EIA Prices, Storage & Production
Get US natural gas statistics as clean records — Henry Hub spot and futures prices, citygate and end-use prices, weekly working gas in storage by region, production, consumption, imports and exports by state — from the U.S. Energy Information Administration's official Open Data bulk file NG.zip.
Gas traders, utilities, analysts and researchers use it to follow storage reports, track prices and build supply-demand balances. EIA publishes 16,080 natural gas series in one 4.4 MB ZIP: this actor reads it, keeps only the series you ask for, and delivers one record per observation with units, frequency, period and area — no API key.
The unit of output is one observation (one series, one period). You pay per observation delivered; a run that finds nothing costs nothing.
📊 Sample Output
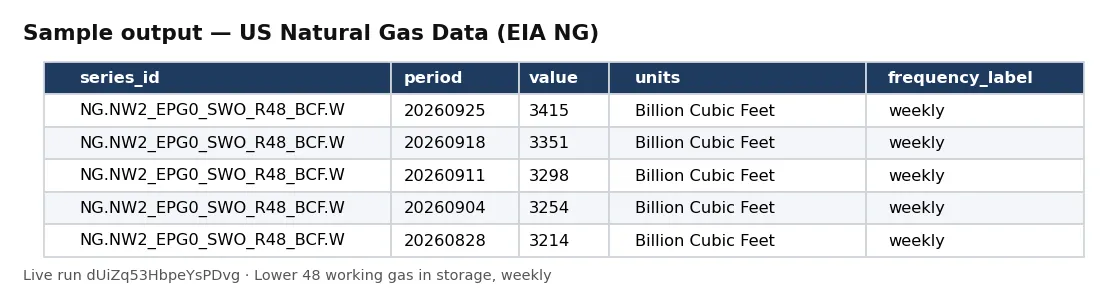
| series_id | period | value | units | frequency_label |
|---|---|---|---|---|
| NG.NW2_EPG0_SWO_R48_BCF.W | 20260925 | 3415 | Billion Cubic Feet | weekly |
| NG.NW2_EPG0_SWO_R48_BCF.W | 20260918 | 3351 | Billion Cubic Feet | weekly |
| NG.NW2_EPG0_SWO_R48_BCF.W | 20260911 | 3298 | Billion Cubic Feet | weekly |
| NG.NW2_EPG0_SWO_R48_BCF.W | 20260904 | 3254 | Billion Cubic Feet | weekly |
| NG.NW2_EPG0_SWO_R48_BCF.W | 20260828 | 3214 | Billion Cubic Feet | weekly |
Rows from live run dUiZq53HbpeYsPDvg on Apify (input: series NG.RNGWHHD. and NG.NW2_EPG0_SWO_R48_BCF., from 2026, 40 records). Notice the weekly Lower 48 storage reports, newest first, in billion cubic feet; Henry Hub prices follow in the same run.
✅ What you get
Every field of each record:
record_id—<series_id>:<period>, unique per observation.series_id— EIA series id, e.g.NG.RNGWHHD.D.series_name— series name as EIA publishes it.units— units, e.g.Dollars per Million Btu.units_short— short units, when EIA gives them.frequency—A,Q,M,W,Dor4(four-week average).frequency_label— annual, quarterly, monthly, weekly, daily, four-week average.period— period exactly as published:2025,2025Q2,202506or20250613.period_start— first day of the period as an ISO date.value— the observation. Only non-null observations are delivered.geography— EIA geography code(s), e.g.USA-TX.geography2— second geography for flows between two areas.iso3166— ISO 3166 code, when given.latitude,longitude— plant-level series only.series_description— EIA's description of the series, when given.series_start,series_end,series_last_updated— the series' first and last period, and when EIA last updated it.source,source_dataset,licence,attribution,observed_at— provenance on every record: EIA and the dataset, the bulk file and its last-modified date, EIA's public-domain statement quoted, the acknowledgment EIA asks for (e.g.Source: U.S. Energy Information Administration (Sep 2026)), and the UTC time the record was read.
⚙️ Sample inputs
1. Store example — Henry Hub spot price
The 10 newest Henry Hub observations (the first matching series); about $0.50 on the Free plan.
2. Narrowed — weekly storage, Lower 48 and regions, 2026
Every weekly working-gas-in-storage report this year, Lower 48 and regions.
3. Bulk — latest value of every Texas series
One record per series covering Texas: its newest observation. More than 1,000 series cover Texas, so raise maxRecords to get them all.
Input fields:
| Field | Meaning |
|---|---|
seriesIdPrefixes | series ids starting with any of these — end with a dot to take every frequency of one series |
seriesIds | exact series ids |
nameContains | series whose name has every word of an entry, any order; put a phrase in double quotes to keep its words together |
geography | text in the geography or ISO code, e.g. USA-TX |
frequencies | any of A, Q, M, W, D, 4 |
periodFrom | first period wanted: 2024, 2024Q2, 2024-06 or 2024-06-15 |
periodTo | last period wanted (same formats) |
latestOnly | one record per series: its newest observation inside the window |
maxRecords | most observations delivered and billed in this run (default 1,000) |
🧾 JSON sample record
🔧 How it works
-
Robots check.
www.eia.gov/robots.txtis read on every run; it allows/opendata/bulk/. A real disallow stops the run with nothing charged. -
Streamed download. The actor opens
https://www.eia.gov/opendata/bulk/NG.zipand decompresses the ZIP line by line as it arrives. Nothing is saved to disk and the file is never downloaded first. -
Filter before parsing. Each line is one series. Its id is checked against your prefixes, ids and frequencies before the line is parsed, so a narrow request skips most of the file. Name and geography filters parse every series line.
-
Deliver, then charge. Non-null observations inside your period window become records, newest first, pushed in batches; each batch is charged after delivery, so records and charges always match. The download stops the moment
maxRecordsor your maximum charge is reached. -
Receipt.
RUN_RECEIPTrecords the file and its date, lines read, series matched, whether the file was read to the end, and delivered and charged counts.
No login, API key, proxy or bot workaround — one public EIA file, and no personal data in it.
💰 Pricing example
Per observation delivered, no start fee, no monthly charge:
| Apify plan | Price per observation |
|---|---|
| Free | $0.05 |
| Bronze | $0.045 |
| Silver | $0.04 |
| Gold, Platinum, Diamond | $0.0335 |
- 10 observations (the Store example): $0.50 on the Free plan, $0.335 on Gold.
- 1,000 observations (the default cap): $50 on Free, $45 on Bronze, $40 on Silver, $33.50 on Gold.
Coverage and size. Live count from the file read on 3 October 2026 (NG.zip, last modified 1 October 2026): 1,019,306 non-null observations in 16,080 series (plus 2,098 category lines = 18,178 lines; the planning index counted 18,178 series and 1,019,306 observations — they agree). The file is 4.4 MB compressed. A filter is required; a whole-file read takes seconds, and a full pull is 1,019,306 records, billed per observation. Frequencies: annual 12,911 series, monthly 3,151, weekly 13, daily 5.
⚖️ Legal & ToS
Data: U.S. Energy Information Administration, Open Data bulk download (NG.zip). EIA's copyright and reuse page says: "U.S. government publications are in the public domain and are not subject to copyright protection. You may use and/or distribute any of our data, files, databases, reports, graphs, charts, and other information products that are on our website or that you receive through our email distribution service." EIA asks for an acknowledgment with the publication date; every record carries one in attribution.
The actor reads only this public file with a declared User-Agent; www.eia.gov/robots.txt allows the path and is checked on every run. No login, key, proxy or form. Energy statistics and facility-level series only — no personal data.
This actor is not affiliated with or endorsed by EIA. Figures are EIA's as published in the file; check EIA's release notes for revisions.
❓ FAQ
Do I need an EIA API key or account? No. The actor reads EIA's public bulk file, which needs no key, login or registration.
Why must I give a series prefix, id, name or geography? Because the file is large (1.02 million observations). A filter keeps runs fast and bills only what you asked for; the actor refuses an unfiltered run with a clear message.
Why did my run return 0 records? Nothing in the file matched — usually a prefix that is too specific or a period window with no data. The receipt shows how many series matched. A zero-record run is not charged.
How fresh is the data?
As fresh as EIA's NG.zip, which EIA republishes as its releases update; each record names the file's last-modified date.
Can I get the whole file?
Yes: widen the filters and raise maxRecords. The file is streamed, never held in memory; the receipt states how far it was read. Large pulls take a long time and are billed per observation.
Where is the weekly storage report?
Weekly working gas in storage series start NG.NW2_EPG0_SWO_: R48 is the Lower 48 and R31 to R35 are the regions.
🆘 Troubleshooting
- 0 records — NG ids start with
NG.; check the id on EIA's natural gas pages. - Too many annual series — add
frequencies:["M"]or["W"]. - Stopped at maxRecords — raise
maxRecordsor uselatestOnly. - CAPPED message — your maximum total charge was reached; raise it in the run options.
🔗 Related Actors
- CFTC Commitments of Traders (COT) Data — Weekly Positions — weekly futures positioning in crude oil, natural gas and power alongside EIA prices.
- EU Fuel Prices — Weekly Oil Bulletin by Country Since 2005 — European pump prices to compare with US gasoline and diesel.
- Spain Fuel Prices by City & Station — Cheapest (MINCOTUR) — station-level fuel prices in Spain.
- ENERGY STAR Product Records — EPA Certified Products — efficiency ratings for appliances and equipment.
🏢 About NexGen Signal — official-source data products from government and regulator publications. Browse the catalog: apify.com/nexgensignal
⭐ Found this useful?
If this actor saved you time, a rating on its Apify Store page helps other buyers find it.
Part of NexGen Signal — official-source data products.


