

Wikipedia Pageviews: Trends, Top Articles & Languages
Pricing
from $3.00 / 1,000 article analyzeds
Wikipedia Pageviews: Trends, Top Articles & Languages
Real page-view numbers for any Wikipedia articles: daily history since 2015 with redirects included, momentum, year-over-year, seasonality and a 3-month forecast, every language edition of a topic, the most-read and surging articles, and a visual report.
Pricing
from $3.00 / 1,000 article analyzeds
Rating
0.0
(0)
Developer

Zach Wallace
Maintained by CommunityActor stats
0
Bookmarked
2
Total users
1
Monthly active users
2 days ago
Last modified
Share
What does Wikipedia Pageviews do?
Wikipedia Pageviews gives you real page-view numbers for any Wikipedia articles, in any language, straight from the Wikimedia Foundation's official statistics. Unlike Google Trends, which only shows relative interest from 0 to 100, these are actual counts of people reading, every day since July 2015.
It does the analysis for you:
- Compare any number of articles over time: total views, daily average, share of attention, peak day, 30-day momentum, year-over-year change, trend direction, seasonal peak month, spikes, and a 3-month forecast for each.
- True totals with redirects: people reach "Taylor Swift" through "Taylor swift", "T. Swift" and dozens of other titles. Wikipedia counts each separately; this Actor adds them back in.
- One topic in every language: how much is "Coffee" read in Japanese, German, Spanish or Persian? See where in the world a topic is followed.
- Most-read and surging articles for any recent days: what the world is reading right now, and what is spiking.
Every run saves a visual report: an interactive chart with a log-scale toggle, article cards with forecasts, language bars and a top list.
It runs on the Apify platform, so you get API access, scheduling, webhooks, integrations (Make, Zapier, n8n, Google Sheets) and monitoring with no setup.
Live example reports
Real reports from real runs:
| Example | What it shows | Report |
|---|---|---|
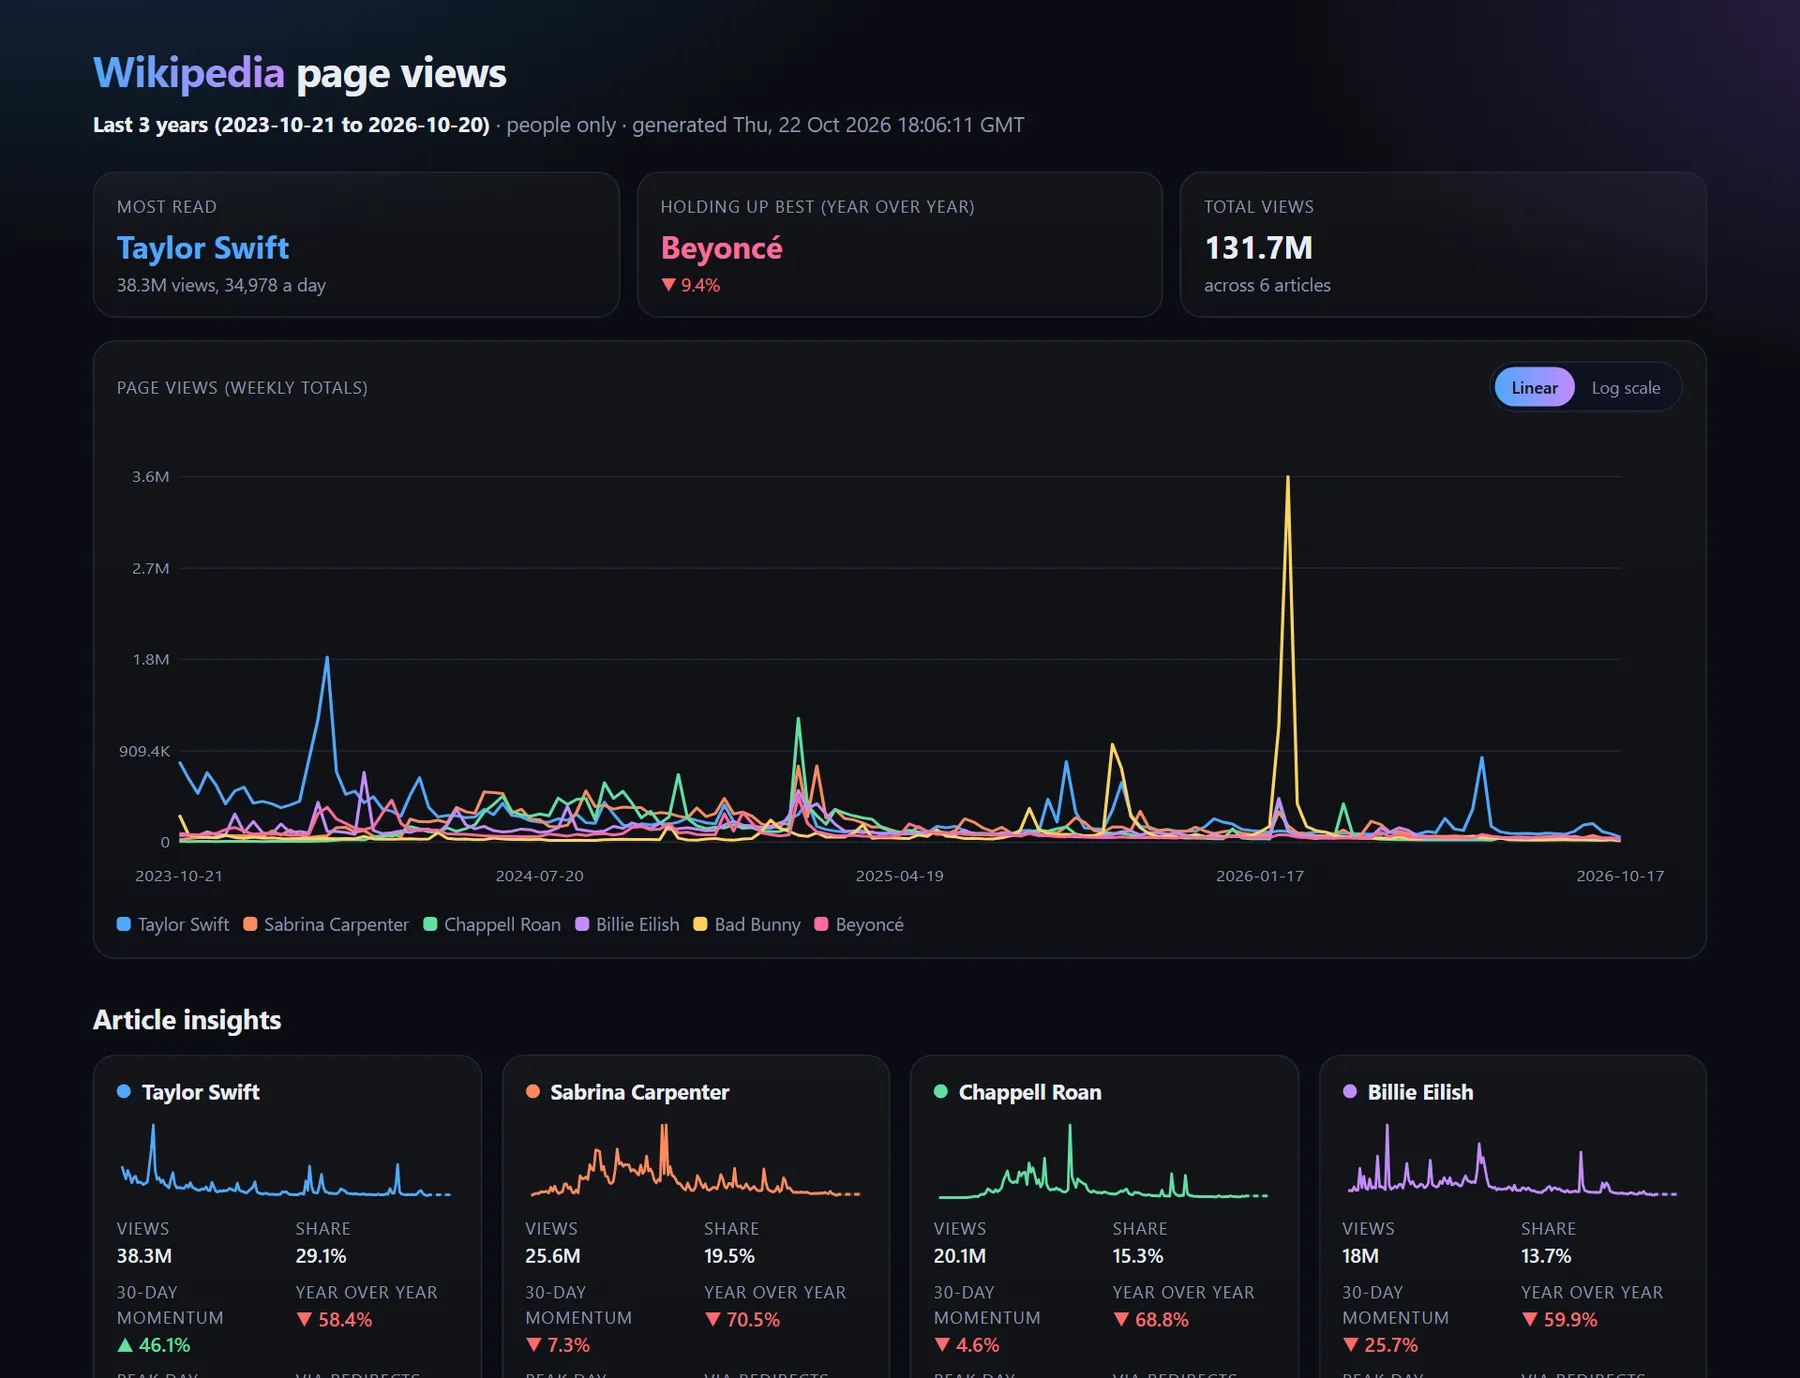
| Pop stars compared | Taylor Swift, Beyoncé, Bad Bunny, Sabrina Carpenter, Chappell Roan and Billie Eilish over 3 years | Open report |
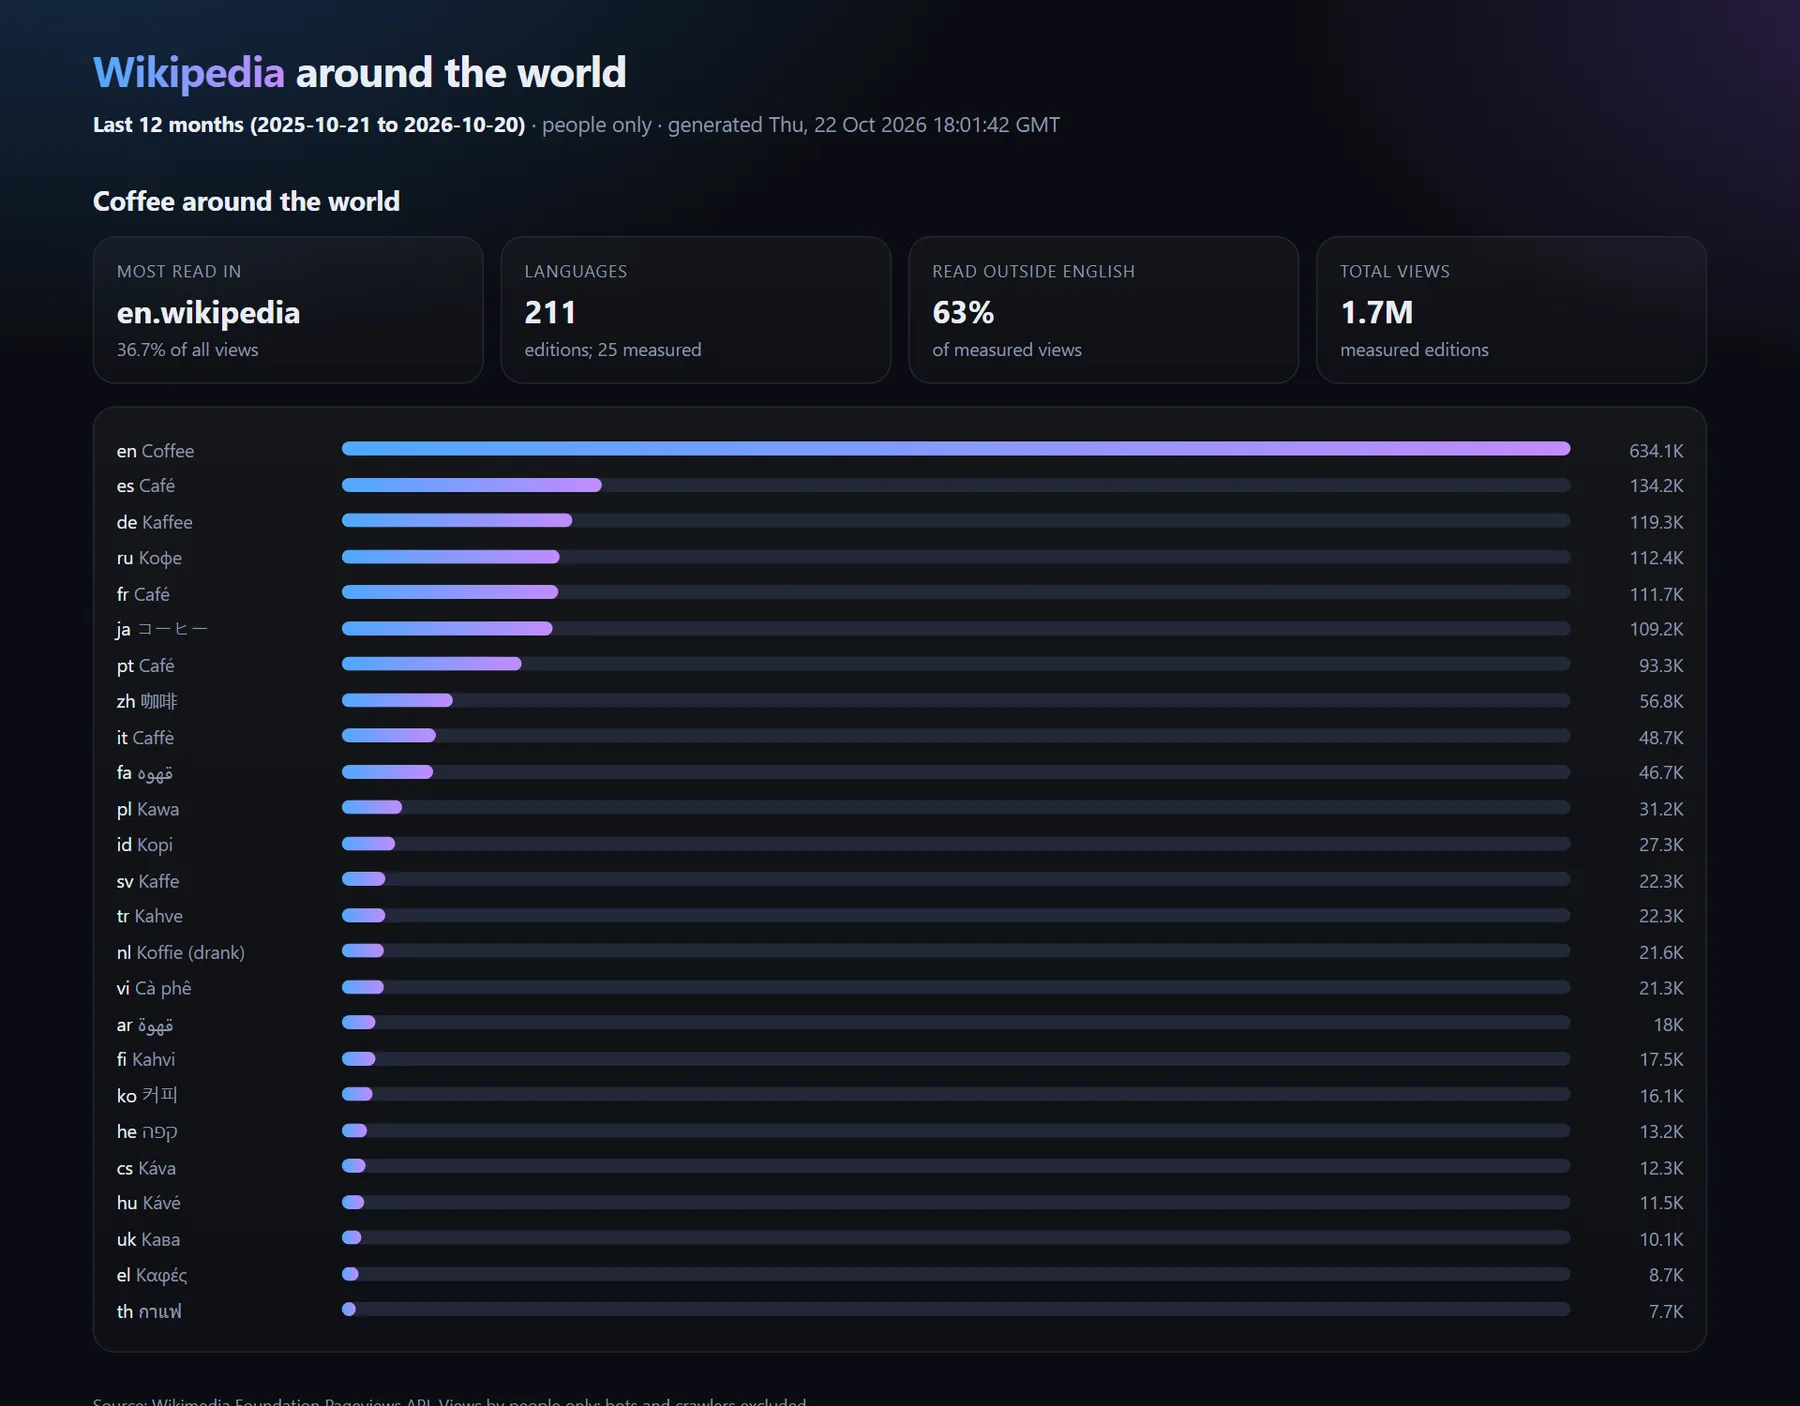
| Coffee in 25 languages | Where in the world people read about coffee | Open report |
| Most read this week | The top 100 articles and what is surging | Open report |
Why use it?
- Attention research: measure public interest in people, brands, products, events or ideas with real numbers rather than an index.
- Media and entertainment: track artists, films, shows and athletes; spot what is trending before it peaks.
- Market and investment signals: page views of companies and products are a well-known proxy for public attention.
- SEO and content: find seasonal topics and rising subjects, and see which language markets care about a topic.
- Academic and data journalism: clean daily series since 2015, with bots and crawlers excluded by default.
How to get Wikipedia page views
- Click Try for free.
- Enter articles: titles, wikipedia.org links in any language, or
de:Berlinstyle for a language edition. - Pick a time range and a mode: Compare articles, One topic in every language, or Most-read and surging articles.
- Click Start. Open Visual report in the Output tab, or download the dataset.
Input
| Field | What it does |
|---|---|
mode | compare, languages or top |
articles | Titles, links or lang:Title. Spelling and capitals are fixed and redirects followed automatically |
language | Language edition for plain titles and for the top list (en, de, ja and so on) |
timeRange | Last 30 days, 90 days, 12 months, 3 years, 5 years, since July 2015, or custom dates |
includeRedirects, maxRedirectsPerArticle | Add views that arrive through alternative titles |
agent | People only (default) or people, bots and crawlers |
includeForecast | 3-month forecast per article (needs about 2.5 years of data) |
languagesLimit | Languages mode: how many language editions to measure |
topDays, topEndDate, topLimit | Top mode: which days and how many articles |
Example: five pop stars over three years.
Example: where in the world people read about coffee.
Output
One row per article (compare), per language edition (languages) or per top article (top), plus the visual report. You can download the dataset in various formats such as JSON, HTML, CSV, or Excel.
A real result (trimmed):
Data fields
| Field | Meaning |
|---|---|
totalViews, averageDailyViews, latestViews | Views in the range (people only by default) |
shareOfAttentionPct | This article's share of all views across your articles |
peakDay, peakViews, spikes | Biggest day and other unusual spikes |
momentum30dPct, yoyChangePct | Last 30 days vs the 30 before, and vs the same period a year earlier |
trendDirection, trendSlopePctPerYear | Rising, stable or falling, from a fitted trend line |
seasonalPeakMonth, seasonalLowMonth | Seasonal pattern (needs 2+ years) |
viewsViaRedirects, redirectSharePct | Views that arrived through alternative titles |
forecastNext3MonthsChangePct, forecastExpectedErrorPct, forecast | 3-month forecast, its typical error, and the daily forecast with a range |
timeline | Every day's views |
shareOfGlobalViewsPct | Languages mode: each edition's share of the topic's views |
daysInDailyTop, bestDailyRank, lastDayVsEarlierPct | Top mode: staying power and surge |
How much does it cost?
You pay per article analysed (or per language edition, or per top article), plus an optional small charge per daily timeline row in long format. The Wikimedia API is fast, so runs are quick: three years of daily views for five articles, with redirects, take well under a minute.
Tips
- Leave redirects on for true totals; for a quick look, lower
maxRedirectsPerArticle. - Use Last 3 years or longer to get year-over-year, seasonality and the forecast.
- Schedule the top mode daily with a webhook to catch what is surging every morning.
- Compare an article across languages before entering a new market.
How does the forecast work?
Each article gets the method that predicted it best in the past. Three simple methods compete (the recent level, the same period last year, and the seasonal pattern adjusted to the recent level) on four past cut-off points, and the winner's average error is reported as forecastExpectedErrorPct.
FAQ, disclaimers, and support
Is this official data? Yes. It comes from the Wikimedia Foundation's public Pageviews API, the same numbers as wikimedia.org statistics tools. Daily figures arrive about a day late, so ranges end two days ago.
Why do some top articles look odd? Wikimedia filters known bots, but occasional automated traffic still reaches the daily top lists. An article with millions of views and little news coverage may be one of those.
Is it allowed? The data is published openly by the Wikimedia Foundation for reuse. The Actor identifies itself to Wikimedia as their API policy asks.
Something not working? Open an issue on the Issues tab with the run link. Need a custom version? Get in touch through the Issues tab.


