BLS US Economic Data Search
Pricing
from $2.00 / 1,000 data fetcheds
BLS US Economic Data Search
BLS US Economic Data Search is an Apify actor that connects directly to the official Bureau of Labor Statistics (BLS) Public Data API v2 and retrieves time series data for US economic indicators.
Pricing
from $2.00 / 1,000 data fetcheds
Rating
0.0
(0)
Developer
Ryan Clinton
Maintained by CommunityActor stats
0
Bookmarked
14
Total users
3
Monthly active users
2 months ago
Last modified
Categories
Share
BLS Economic Signal Engine
Economic monitoring, not economic data. Turn official BLS releases into decisions.
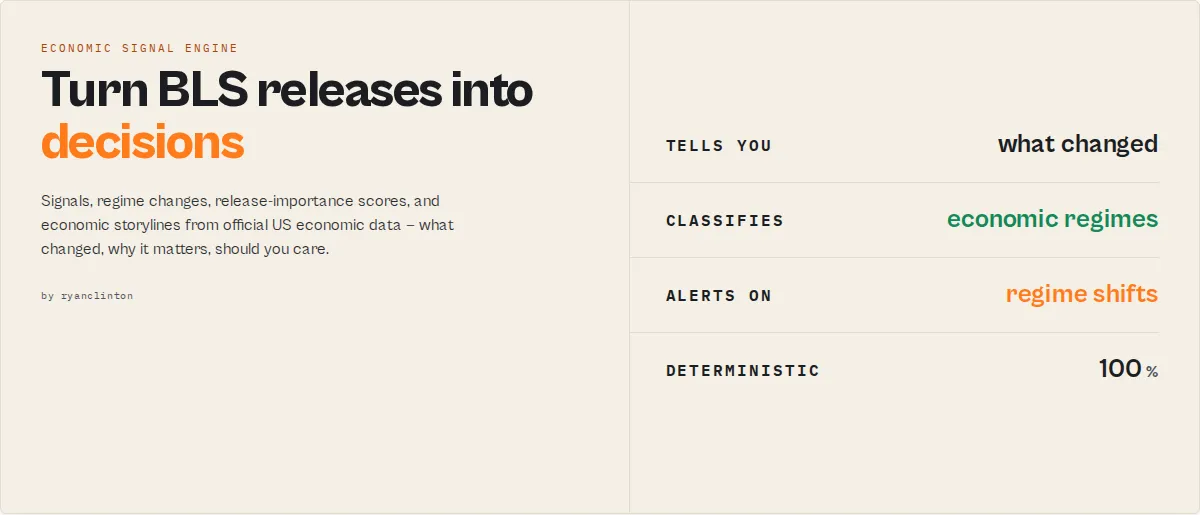
One record tells you what's happening in the US economy right now:
Instead of making you manually interpret CPI, wages, employment, and inflation reports, the actor produces that analyst-style brief from official Bureau of Labor Statistics releases — signals, alerts, regime changes, risk scores, release-importance ratings, and economic storylines — and answers the three questions you actually have:
- What changed?
- Why does it matter?
- Should I care?
No series IDs to look up. No manual analysis. No spreadsheet work. Deterministic, with no LLMs in the scoring path.
Monitor the US economy — and your industry: the macro economy, plus Construction, Manufacturing, Retail, Transportation, and Energy sector packs in one click.
Before vs after
Without this actor — you get a number and a pile of questions:
Is inflation high? Is it rising? Is it accelerating? Is this release important?
With this actor — the value is obvious:
A new category: Economic Signal Engine
Traditional economic APIs return numbers. An Economic Signal Engine returns decisions.
| Capability | BLS API | FRED | This actor |
|---|---|---|---|
| Raw data | ✅ | ✅ | ✅ |
| Plain-language search (no series IDs) | ❌ | ❌ | ✅ |
| Tells you what changed | ❌ | ❌ | ✅ |
| Tells you why it matters | ❌ | ❌ | ✅ |
| Economic regime detection + transitions | ❌ | ❌ | ✅ |
| Release-importance scoring | ❌ | ❌ | ✅ |
| Revision monitoring | ❌ | ❌ | ✅ |
| Sector / industry intelligence | ❌ | ❌ | ✅ |
| Analyst-style summary in one record | ❌ | ❌ | ✅ |
| Alert-ready signals for automation | ❌ | ❌ | ✅ |
What problems does this solve?
"What changed this month?" → changeFeed, economicDiff, regimeTransition, releaseImpact
"Is this release important?" → releaseImpact (0-100 + MAJOR/NOTABLE/MINOR/ROUTINE), events, alerts
"Are consumers under pressure?" → consumerStressRisk, realWageGrowth, inflationBreadth
"Is the economy improving or deteriorating?" → economicHealth, regime, storyline
"How is my industry doing?" → sectorPack (construction / manufacturing / retail / transportation / energy) → a sector health + risk + storyline block
"Which series do I even need?" → search ("construction wages") or a bundle — no BLS codes required
Why people use it
- Investors & traders — monitor inflation, wages, and labor conditions for macro positioning; get alerted the moment the regime changes.
- Journalists — see what changed since the last release without manually diffing two reports; paste the
storylineandchangeFeedstraight into a piece. - Business operators — track the labor-market and inflation pressures hitting their sector with a single
sectorPack. - Analysts & consultants — a deterministic morning brief (
economicHealth+regime+storyline) with auditable drivers. - Automation builders — trigger Zapier / Make / n8n / Slack workflows from stable economic signals and alerts instead of parsing raw numbers.
30-second demo
Input:
Output (excerpt of the summary record on run 2+):
That's the entire value proposition: you asked for the labor dashboard, and the actor told you the labor market is softening, flagged it, and showed you exactly what changed since last month.
Economic Git — see exactly what changed since the last release
Run with a watchlistName on a schedule and each run returns a deterministic diff of the economy, not another pile of numbers:
- Inflation accelerated.
- Real wages improved.
- Recession risk increased.
- Regime shifted: DISINFLATION → STAGFLATION.
That's the economicDiff.summary[] + changeFeed[] + regimeTransition working together. No manual comparisons, no spreadsheets, no diffing two PDF reports by hand. The actor also surfaces BLS revisions to prior months — the changes economists watch as closely as the latest print.
Who this is for (and not for)
Not for:
- People who only need a raw CPI value and already know the series ID
- One-off, single-number extraction
- Users who want a charting/visualisation tool
Built for:
- Monitoring economic change on a schedule
- Automated alerting (Zapier / Make / n8n / Slack)
- Economic and industry dashboards
- Analysts, investors, journalists, and operators who need the decision, not the dataset
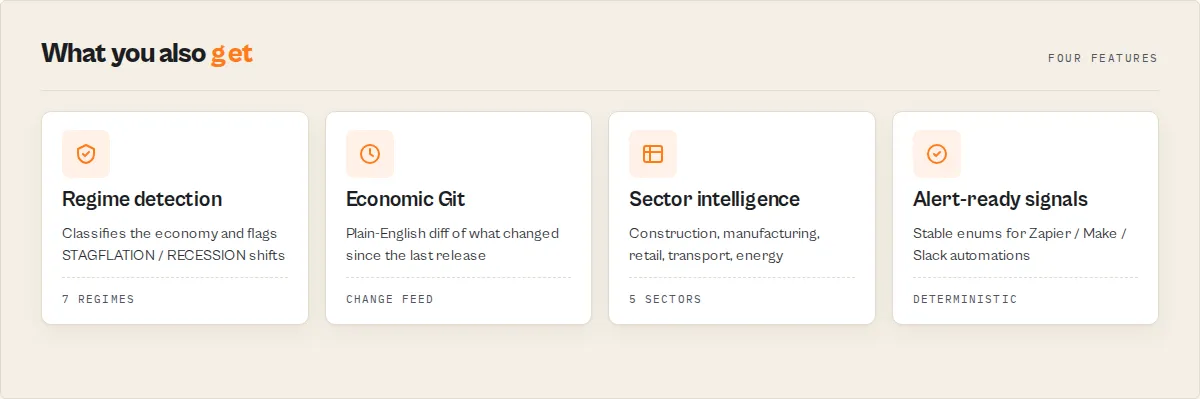
Key features
- Plain-language search — type
inflation,core cpi,construction wages,food prices,unemploymentand the actor resolves it to the right BLS series. No series-ID lookup. - One-click dashboard bundles —
inflation-dashboard,labor-dashboard,recession-watch,consumer-priceseach pull a curated set of indicators in a single run - Built-in intelligence layer — every series returns year-over-year change, period-over-period change, trend, momentum/acceleration, a benchmark vs a citable reference, a historical percentile within the window, data-quality flags, and a plain-English interpretation with a stable
signalenum (INFLATION_ACCELERATING,UNEMPLOYMENT_RISING_FAST,WAGE_GROWTH_STRONG,DEFLATION, and more) - Economic-health score & regime — the summary record carries a 0-100 headline economic-health
score(inflation/labor/wage sub-scores), plus a deterministic economic-regime label (HOT_GROWTH/DISINFLATION/STAGFLATION/LABOR_SOFTENING/RECESSION_RISK/DEFLATION_RISK/STABLE_EXPANSION) - Real wage growth — wages minus CPI inflation when both are present, with a plain-English purchasing-power read
- Revision & release monitoring (optional) — name a watchlist and every run reports a
changeFlag(NEW / RISING / FALLING / STABLE) plus detected revisions to prior months and newly-published periods — diffed against the prior run, built for scheduled monthly use. AddincludeReleaseCalendarfor each series' publication cadence + next reference period. - Automatic long-range retrieval — request any span (e.g. 1990–2025); the actor chunks around the BLS per-request year cap and merges the result, so you never hit the quirk yourself
- Output profiles — choose
minimal(analysis + summary only),standard(raw points + full analysis), orfullto match your downstream consumer - Five built-in presets for the most requested economic indicators: CPI inflation, unemployment rate, nonfarm employment, average hourly earnings, and PPI
- Custom series support -- enter any valid BLS series ID (or multiple IDs separated by commas) to pull exactly the data you need from hundreds of available series
- Flexible year range -- specify start and end years to control how much historical data is returned, up to a 20-year window without an API key
- No API key required -- works immediately with no registration using the BLS public API, though a free key unlocks higher rate limits
- Clean, flat output -- each data point is a separate record with series metadata, period details, numeric value, footnotes, and a timestamp, ready for CSV export or JSON processing
- Human-readable series names -- the actor maps common series IDs to descriptive names so output is immediately understandable without cross-referencing BLS documentation
- Automatic invalid data filtering -- data points marked as unavailable by the BLS (value "-") are automatically excluded from the output
- Parsed numeric values -- string values from the API are automatically converted to proper numbers for immediate computation and analysis
- Footnote consolidation -- multiple footnote entries per data point are joined into a single readable string
How it works: discover, analyze, monitor, decide
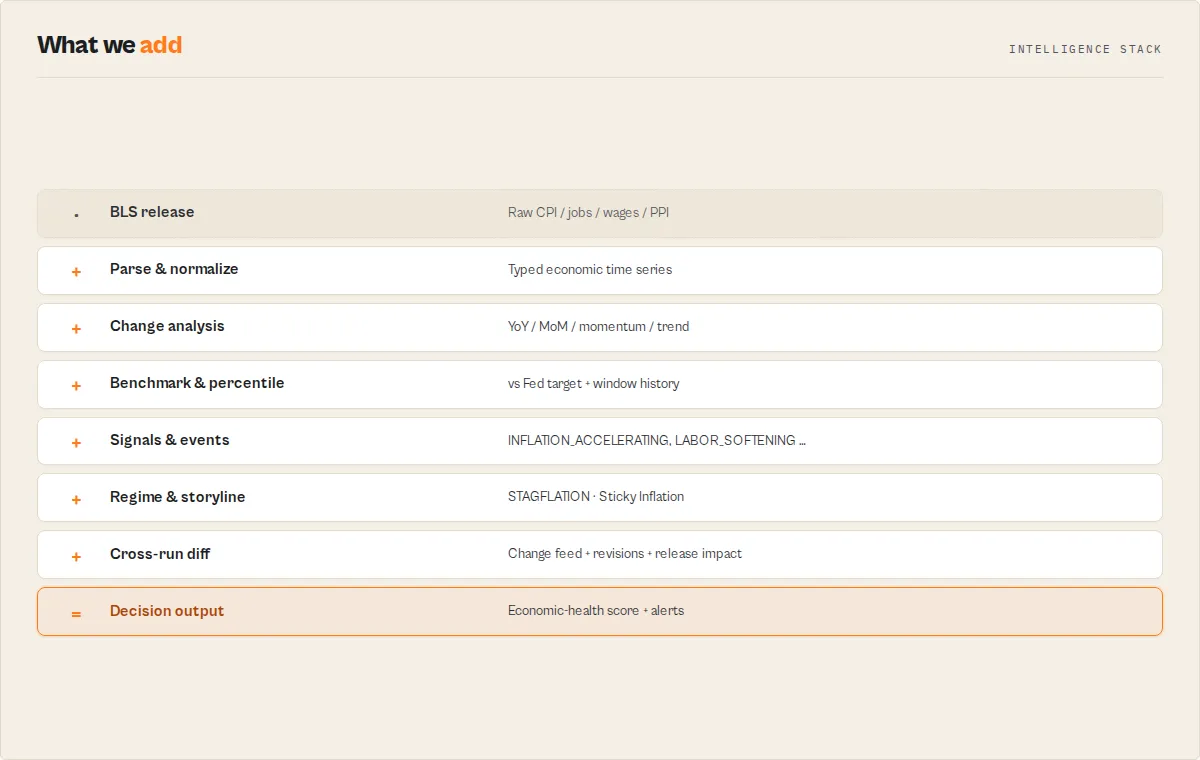
The capabilities group into four pillars that map to how you actually use US economic data:
- Discover — find the right series without knowing BLS codes: plain-language
search("construction wages") and one-click dashboardbundles (inflation, labor, recession-watch, consumer-prices). - Analyze — turn each series into understanding: year-over-year and period-over-period change, momentum (accelerating vs cooling), a benchmark vs a citable reference (e.g. the Fed's 2% target), and a Historical Context Engine that tells you where today's reading sits — "inflation is higher than 92% of observations in the selected period".
- Monitor — run it on a schedule and see what moved: a change feed (
previousSignal → currentSignalper indicator — the economic "git diff"), a release-importance score (0-100 + MAJOR/NOTABLE/MINOR/ROUTINE — was this release worth reading?), BLS revisions to prior months, newly-published periods, watchlistchangeFlags, and (withincludeReleaseCalendar) each series' publication cadence. - Decide — branch automations on stable outputs: regime transitions (
DISINFLATION → STAGFLATION— the macro alert people build dashboards around), a deterministic storyline theme (Sticky Inflation / Soft Landing / Consumer Squeeze / …) with drivers, discrete events + routing-ready alerts, per-seriessignalenums, the economic-health score, recession-risk + consumer-stress-risk, inflation-breadth, and the economic-regime classification.
How to use the Economic Signal Engine
- Navigate to the actor page on Apify and click Try for free.
- In the input form, select a Data Preset from the dropdown (CPI, Unemployment, Employment, Wages, PPI) or choose "Custom Series IDs" and enter your own series IDs.
- Set the Start Year and End Year for the data range you want.
- Optionally paste your free BLS API Key if you need higher rate limits.
- Click Start and wait a few seconds for the run to complete.
- Open the Dataset tab to view, download, or export your results in JSON, CSV, Excel, or other formats.
You can also call this actor programmatically via the Apify API or integrate it into your workflow using the Apify JavaScript or Python client.
Example: Track CPI inflation with default settings
The simplest possible input -- just use the defaults to get CPI data for the last 5 years:
Example: Track CPI inflation over the last 5 years
Example: Get unemployment rate data for a decade
Example: Query multiple custom series
Example: Pull PPI data for a single year
Example: API call via cURL
Example: Python client integration
Input parameters
| Parameter | Type | Required | Default | Description |
|---|---|---|---|---|
search | string | No | -- | Plain-language concept search — type inflation, core cpi, unemployment, wages, food, energy, housing, payrolls, hours, etc. and the actor resolves it to the matching BLS series (no series IDs to look up). Takes precedence over bundle/preset/customSeriesIds. |
bundle | string (select) | No | -- | One-click macro dashboard pack: inflation-dashboard (CPI + Core CPI + PPI), labor-dashboard (unemployment + labor force + employment + payrolls + wages), recession-watch (unemployment + payrolls + wages + hours), consumer-prices (CPI + food + housing + energy). |
sectorPack | string (select) | No | -- | Industry intelligence pack — construction, manufacturing, retail, transportation, energy. Pulls the sector's employment + wages (+ relevant prices) and adds a sector health/risk/storyline block. Precedence: below search, above bundle/preset. |
preset | string (select) | No | cpi | Quick preset for common economic indicators. Options: CPI, Unemployment Rate, Total Nonfarm Employment, Average Hourly Earnings, PPI, or Custom Series IDs. |
customSeriesIds | string | No | -- | Comma-separated BLS series IDs (e.g., CUUR0000SA0,LNS14000000). Only used when preset is set to "Custom Series IDs". Find series IDs at data.bls.gov. |
includeCorrelations | boolean | No | false | When ≥2 series are in the run, emit a correlation matrix (Pearson over period-over-period changes) in the summary record. |
startYear | integer | No | 2020 | Start year for the data range. |
endYear | integer | No | 2025 | End year for the data range. |
apiKey | string | No | -- | Optional BLS registration key for higher request limits. Get one free at data.bls.gov/registrationEngine. |
includeAnalysis | boolean | No | true | Emit the per-series analysis record (year-over-year change, trend, interpretation) and the run-level summary record. |
includeDataPoints | string (select) | No | auto | Emit every raw BLS observation as its own row. auto = include unless outputProfile is minimal; yes = always; no = never (analysis + summary only). |
outputProfile | string (select) | No | standard | minimal (analysis + summary only), standard (raw points + full analysis), or full. |
watchlistName | string | No | -- | Name a watchlist to enable cross-run change detection. Each series is diffed against the prior run on the same watchlist. Leave blank for a stateless one-off run. |
Preset reference
The actor includes five built-in presets that map to specific BLS series IDs. This table shows exactly which series each preset queries.
| Preset | Series ID | Series Name | Description |
|---|---|---|---|
cpi | CUUR0000SA0 | CPI - All Urban Consumers (All Items) | Tracks changes in the price level of a market basket of consumer goods and services. The primary measure of US inflation. |
unemployment | LNS14000000 | Unemployment Rate (Seasonally Adjusted) | The percentage of the civilian labor force that is jobless, actively seeking work, and available to work. |
employment | CES0000000001 | Total Nonfarm Employment (Thousands) | The total number of paid US workers excluding farm employees, government workers, and nonprofit organization employees. |
wages | CES0500000003 | Average Hourly Earnings - All Private | Average hourly earnings of all employees on private nonfarm payrolls, seasonally adjusted. |
ppi | WPSFD4 | PPI - All Commodities | Measures average changes in selling prices received by domestic producers for their output. A leading indicator of consumer inflation. |
The actor also recognizes several additional series IDs with built-in human-readable names: LNS11000000 (Civilian Labor Force Level), LNS12000000 (Civilian Employment Level), and CUUR0000SA0L1E (CPI - All Items Less Food and Energy). For any unrecognized series ID, the raw ID is used as the series name.
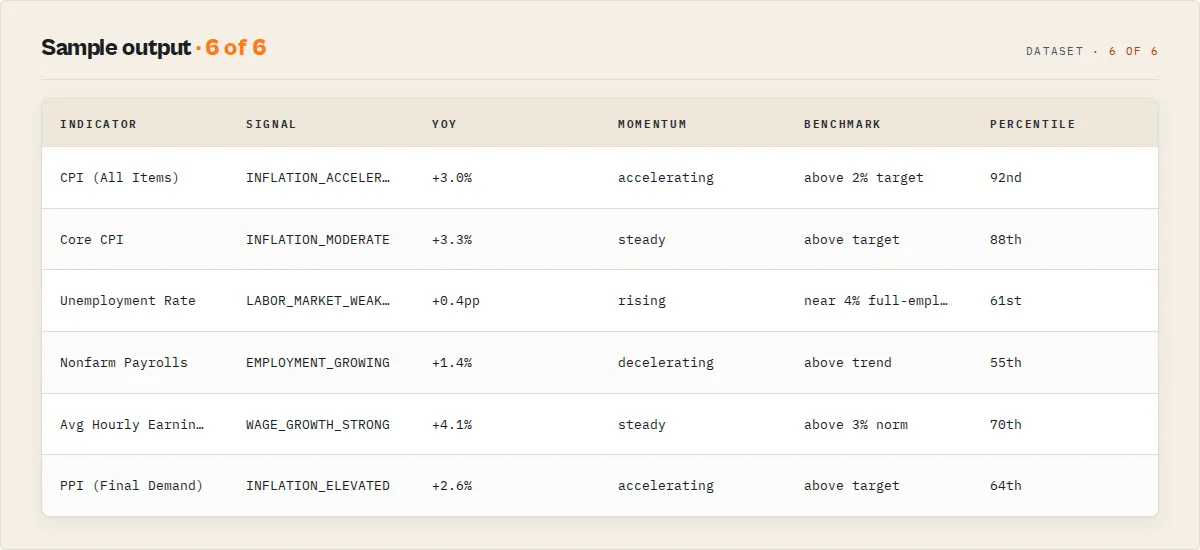
Output example
Each run produces a dataset of data point records. Here are realistic examples of the output for different presets.
Unemployment rate output
CPI output
Each raw observation is a dataPoint record. The actor also emits one analysis record per series and one summary record per run — see Output record types below.
Output fields reference
| Field | Type | Description |
|---|---|---|
seriesId | string | The BLS series identifier (e.g., LNS14000000). Use this to cross-reference with BLS documentation or for subsequent queries. |
seriesName | string | Human-readable name of the series (e.g., "Unemployment Rate (Seasonally Adjusted)"). Resolved from a built-in lookup table; falls back to the raw series ID for unrecognized series. |
year | string | Four-digit year of the data point (e.g., "2024"). |
period | string | BLS period code. Monthly data uses M01 through M12. Annual averages use M13. Quarterly data uses Q01 through Q05. |
periodName | string | Human-readable period name (e.g., "January", "February", "Annual"). |
value | string | Raw value as returned by the BLS API, preserved as a string to maintain exact precision. |
numericValue | number or null | Parsed numeric value for computation and analysis. Null if the raw value cannot be parsed as a number. |
footnote | string or null | Any footnotes attached to the data point by the BLS, joined with semicolons if multiple exist. Null if no footnotes are present. |
extractedAt | string | ISO 8601 timestamp of when the data was extracted by this actor. |
Output record types
The dataset mixes record types, each tagged with a recordType field so you can filter. Use the Economic Analysis dataset view to see the decision layer first, or the Raw Data Points view for the underlying series.
recordType | When | What it carries |
|---|---|---|
dataPoint | one per BLS observation (unless outputProfile: minimal) | series ID, name, year, period, raw + numeric value, footnote |
analysis | one per series | YoY + MoM change, trend, statistics, momentum (acceleration), benchmark (vs citable reference), historicalContext (percentile in window), quality (footnote flags), dataRecency, and an interpretation block with band, direction, and a stable signal enum |
summary | one per run | every indicator rolled up, economicHealth, regime + regimeTransition, storyline (+ primaryDrivers), sector (with sectorPack), inflationBreadth, riskScores, events[], alerts[], changeFeed[] + economicDiff + releaseImpact (watchlist), real wage growth, signal counts, headline |
error | only on failure | error: true + failureType (no-data / timeout / parse-error / api-error / invalid-input / unexpected-error) + message, so the run finishes cleanly instead of failing |
Analysis record example (CPI)
Summary record example
(changeFeed / economicDiff / releaseImpact / regimeTransition are null here because this is a one-off run — set watchlistName and they populate from run 2, e.g. changeFeed: [{ "indicator": "CPI …", "previousSignal": "INFLATION_MODERATE", "currentSignal": "INFLATION_ACCELERATING" }], economicDiff: { "summary": ["Inflation accelerated.", "Economic-health score fell 6 points."] }, and regimeTransition: { "from": "DISINFLATION", "to": "STAGFLATION", "severity": "high" }. inflationBreadth is null until ≥2 CPI components are in the run — use the consumer-prices bundle. sector populates when a sectorPack is set.)
(laborScore/correlations are null here because this run carried no unemployment series and correlations weren't requested — add a labor-dashboard bundle or includeCorrelations: true to populate them.)
The numericValue figures above are illustrative; the actor always returns whatever the BLS API currently publishes.
Watchlist record fragment
When you set watchlistName, each analysis record gains a watchlist block:
newDataDetected / newPeriods flag periods published since the last run (release monitoring); revisions flags prior months whose value the BLS changed since you last saw them (when a revision is present, the analysis record's quality.isRevised flips to true). On the first run for a watchlist, every series carries changeFlag: "NEW" with null deltas and no revisions.
Release schedule fragment
When you set includeReleaseCalendar: true, each analysis record gains a releaseSchedule block:
This tells you the publication cadence and the next period that will be published. It deliberately does not invent a precise release date — the BLS timeseries API doesn't return the release calendar, so for exact dates the block links you to the official BLS schedule.
Technical details
Understanding how this actor works under the hood can help you get the most out of it and troubleshoot any issues.
POST-only API architecture
Unlike most REST APIs that use GET requests with query parameters, the BLS Public Data API v2 exclusively uses POST requests with a JSON body. The actor constructs a single POST request to https://api.bls.gov/publicAPI/v2/timeseries/data/ with a JSON payload containing the following fields:
seriesid-- an array of BLS series ID stringsstartyear-- the start year as a stringendyear-- the end year as a stringregistrationkey-- the optional API key (included only when provided)
This means all data for all requested series and the full year range is returned in a single API response -- there is no pagination to manage. The actor makes exactly one HTTP request per run regardless of how many series or years you request.
Preset resolution system
When you select a preset (e.g., "unemployment"), the actor resolves it to the corresponding BLS series ID (LNS14000000) from its internal mapping table. When you choose "Custom Series IDs", the actor parses your comma-separated string, trims whitespace, and filters empty entries. In both cases, the resolved array of series IDs is passed to the API request.
String-to-number parsing
The BLS API returns all data values as strings (e.g., "246.819" for a CPI value or "4.1" for an unemployment rate). The actor automatically parses each string value into a proper JavaScript number using parseFloat and stores it in the numericValue field. If parsing fails (which can happen with special markers), numericValue is set to null. The original string value is always preserved in the value field.
Series name lookup
The actor maintains an internal mapping of common BLS series IDs to human-readable names. When transforming the API response, each series ID is looked up in this table. Recognized series get descriptive names like "CPI - All Urban Consumers (All Items)". Unrecognized series IDs (which you may encounter when using custom IDs) are used as-is for the seriesName field.
Footnote consolidation
BLS data points can have multiple footnotes, each containing a code and text description. The actor filters out empty footnotes, extracts the text from each remaining footnote, and joins them with semicolons into a single string. If no footnotes exist, the field is set to null.
Response status validation
After receiving the API response, the actor checks the status field. The BLS API returns REQUEST_SUCCEEDED for successful queries. If the status indicates failure -- such as when you exceed the daily request limit, provide an invalid series ID, or request a year range beyond the allowed maximum -- the actor logs detailed error messages (including all messages from the BLS response) and pushes the error information to the dataset so you can diagnose the issue without checking logs.
Invalid value filtering
The BLS uses a dash character ("-") to indicate data points where no value is available for that period. The actor automatically filters these out of the output so your dataset contains only valid, usable data points. This ensures every record in your dataset has a meaningful value that can be used in calculations and analysis.
BLS API key limits comparison
The BLS API works without any registration, but a free API key significantly improves your limits.
| Feature | Without API Key | With Free API Key |
|---|---|---|
| Daily request limit | 25 requests | 500 requests |
| Maximum year range | 20 years | 10 years |
| Maximum series per request | 25 series | 50 series |
| Catalog data | Not available | Available |
| Calculations | Not available | Available |
| Annual averages | Not available | Available |
| Registration cost | Free | Free |
Note the counterintuitive year range limit: registered users get a smaller maximum year range (10 years) than unregistered users (20 years). If you need more than 10 years of data with a registered key, you will need to make multiple runs with different year ranges.
Register for a free key at data.bls.gov/registrationEngine. Registration takes approximately 30 seconds.
How much does it cost to use?
The Economic Signal Engine is extremely lightweight. It makes one BLS API request (a few when auto-chunking a long year range), transforms the response, computes the deterministic intelligence layer in memory, and outputs the results. A typical run uses approximately 128–256 MB of memory and completes in under 30 seconds.
Estimated cost per run: Under $0.005 (less than half a cent) in Apify platform credits.
Apify offers a free tier that includes $5 of monthly platform credits -- enough to run this actor hundreds of times per month at no cost. For most users tracking a few economic indicators on a weekly or monthly schedule, the free tier will be more than sufficient.
The BLS API itself is completely free. No charges are applied by the Bureau of Labor Statistics regardless of whether you use a registration key or not.
| Scenario | Memory | Duration | Estimated Cost |
|---|---|---|---|
| Single preset, 5-year range | 128 MB | ~10 seconds | ~$0.001 |
| Single preset, 20-year range | 128 MB | ~15 seconds | ~$0.002 |
| Multiple custom series, 5-year range | 128 MB | ~15 seconds | ~$0.002 |
| Scheduled daily run (30 runs/month) | 128 MB | ~10 seconds each | ~$0.03/month |
Common use cases
- Inflation tracking -- monitor CPI trends over time to understand purchasing power changes, inform pricing strategies, or support economic reporting. Pull monthly CPI data and compare year-over-year changes.
- Labor market analysis -- track unemployment rates, nonfarm payrolls, and labor force participation to assess employment conditions. Combine employment and wage data for a comprehensive labor market picture.
- Wage growth monitoring -- follow average hourly earnings trends to evaluate compensation dynamics across the private sector. Compare wage growth against CPI inflation to calculate real wage changes.
- Producer price forecasting -- use PPI data as a leading indicator of consumer inflation. Rising producer prices often signal future CPI increases, making PPI valuable for forward-looking analysis.
- Academic research -- access decades of official government statistics for economic research papers, dissertations, and coursework. The structured output integrates easily with statistical software and data analysis tools.
- Financial dashboards -- schedule recurring runs to feed live economic indicators into business intelligence tools, Google Sheets dashboards, or custom reporting applications.
- Journalism and reporting -- quickly pull official economic statistics for news articles, fact-checking, and data-driven stories without navigating the BLS website or writing custom scripts.
- Policy analysis -- compare economic indicators across time periods to evaluate the impact of policy changes on employment, inflation, and wages.
Tips for best results
- Use presets for common indicators. The built-in presets cover the five most popular BLS data series. If you just need CPI or unemployment data, selecting a preset is the fastest way to get started.
- Register for a free BLS API key. Even though the actor works without one, a registration key increases your daily limit from 25 to 500 requests and unlocks additional features like annual averages and calculations. Sign up at data.bls.gov/registrationEngine.
- Mind the year range limits. Without an API key, the BLS supports up to a 20-year range per request. With a key, the maximum drops to 10 years. Stay within these limits to avoid API errors.
- Find additional series IDs on the BLS website. Visit data.bls.gov to browse hundreds of available series covering regional employment, industry-specific prices, import/export prices, productivity, and more. Each series page displays its ID in the URL or header.
- Combine multiple series in a single run. Use the "Custom Series IDs" option to query several series separated by commas. This is more efficient than running the actor multiple times and stays within the per-request series limit (25 without key, 50 with key).
- Schedule recurring runs. Set up a monthly schedule on Apify to automatically capture new BLS data releases. CPI is typically released mid-month, employment data comes out on the first Friday, and PPI follows shortly after.
- Use the numericValue field for analysis. While the raw
valuefield preserves the exact string from the BLS, thenumericValuefield is already parsed as a number, making it ready for calculations, charting, and aggregation without additional processing. - Check footnotes for data quality context. Some data points carry footnotes from the BLS that explain revisions, methodology changes, or preliminary status. The
footnotefield captures this context so you can assess data quality. - Export to CSV for spreadsheet analysis. The flat output structure (one row per data point) is designed for easy import into Excel, Google Sheets, or any statistical software. Use the Apify dataset export feature to download CSV files directly.
- Compare CPI and PPI together. Query both indices in a single custom run to analyze the relationship between producer and consumer prices. Rising PPI often foreshadows CPI increases.
FAQ
Do I need a BLS API key to use this actor? No. The actor works without any API key using the BLS public API v2. However, registering for a free key at data.bls.gov/registrationEngine increases your daily request limit from 25 to 500 and unlocks additional capabilities.
What economic data can I access? Any time series published by the Bureau of Labor Statistics. The built-in presets cover CPI (inflation), unemployment rate, nonfarm employment, average hourly earnings, and PPI. Using custom series IDs, you can access hundreds of additional data series including regional employment data, industry-specific price indices, import/export prices, productivity statistics, and more.
How often is BLS data updated? Most major indicators are updated monthly. CPI is typically released in the second or third week of each month. Employment data (nonfarm payrolls) is released on the first Friday of each month. PPI is released mid-month. Some series are updated quarterly or annually. Schedule your actor runs accordingly to capture fresh data.
Can I query multiple series at once? Yes. Select the "Custom Series IDs" preset and enter multiple series IDs separated by commas. The BLS API supports up to 25 series per request without an API key and 50 series with a registered key. All data points for all series will appear in a single output dataset.
What is a BLS series ID and where do I find one?
A series ID is a unique alphanumeric code that identifies a specific BLS data series. For example, CUUR0000SA0 is the CPI for All Urban Consumers and LNS14000000 is the seasonally adjusted unemployment rate. You can find series IDs by browsing data.bls.gov, where each data series page shows its ID. The BLS also provides a series ID finder that explains the structure of IDs for each survey program.
Why does the year range limit decrease with an API key? This is a quirk of the BLS API design. Unregistered users can request up to 20 years of data per call, while registered users are limited to 10 years. The tradeoff is that registered users get access to 500 daily requests (vs. 25), up to 50 series per request (vs. 25), and additional features like calculations and annual averages. If you need more than 10 years with a key, make separate runs for different year ranges.
What formats can I export the data in? Apify datasets support export in JSON, CSV, Excel, XML, and RSS formats. You can also access results programmatically via the Apify API or connect them directly to Google Sheets, Slack, email, and other integrations through Apify's built-in integration options.
What happens if the BLS API returns an error? The actor checks the API response status and logs detailed error messages. Common issues include exceeding the daily request limit, requesting a year range beyond the allowed maximum, or specifying invalid series IDs. Error details are logged and pushed to the dataset so you can diagnose the problem.
What does the period code mean?
The period field uses BLS conventions: M01 through M12 represent January through December for monthly data. M13 represents an annual average (available only with a registered API key). Quarterly series use Q01 through Q05. The periodName field provides the human-readable equivalent so you do not need to decode the period codes yourself.
Can I get seasonally adjusted vs. non-adjusted data?
Yes, but it depends on the series ID you query. Different series IDs represent different seasonal adjustment variants. For example, LNS14000000 is the seasonally adjusted unemployment rate, while LNU04000000 is the non-adjusted version. Check data.bls.gov to find the specific series ID for the adjustment variant you need.
How does this differ from the FRED Economic Data Search actor? While both actors provide US economic data, they connect to different sources. This actor pulls directly from the BLS, which is the primary source for labor market, price, and productivity data. The FRED actor connects to the Federal Reserve Bank of St. Louis database, which aggregates data from the BLS and many other sources (840,000+ series). Use this BLS actor when you specifically need BLS data at the source; use FRED for a broader range of economic indicators including GDP, interest rates, money supply, and financial market data.
Is there a delay between BLS publishing data and this actor being able to retrieve it? No. The actor queries the BLS API in real time. As soon as the BLS publishes new data points to their API, this actor can retrieve them. There is no caching or delay on the actor side.
Use in Dify
Drop this actor into Dify workflows via the Apify plugin's Run Actor node. Each indicator returns a scored, classified, interpreted JSON record — a stable interpretation.signal enum (INFLATION_HIGH / LABOR_MARKET_WEAKENING / WAGE_GROWTH_STRONG / EMPLOYMENT_GROWING / DEFLATION / …) plus an interpretation.direction (improving / worsening / stable) and a band your downstream if/else node branches on. A raw BLS API call returns index numbers like 317.671; this returns the decision — "inflation is moderate and worsening".
- Actor ID:
ryanclinton/bls-economic-data - Sample input (track inflation + wages, with cross-run change detection for a monthly schedule):
- Branching example — a Dify if/else node routes on the summary record's
alerts[]/events[](or a per-seriesinterpretation.signal):alerts[].severitycontainshigh→ page / Slack the desk immediatelyevents[].typecontainsREAL_WAGES_NEGATIVEorLABOR_MARKET_SOFTENING→ route to a recession-watch branchreleaseImpact.severityishigh→ "this release mattered — review now"changeFeedis non-empty → post thepreviousSignal → currentSignaldiffs to a channel- otherwise → log and continue
- Opt-in modes Dify workflows can leverage: set
watchlistNameto turn the actor into a stateful monitor (thewatchlist.changeFlag+ rate/value deltas drive "what changed since last run" branches); setoutputProfile: "minimal"to feed the LLM only the decision layer, not the raw series. - The run-level
summaryrecord'sindicators[]andsignalCountsare usable verbatim in a Dify variable — no LLM rewriting needed to get a structured economic snapshot.
Integrations and related actors
The Economic Signal Engine works seamlessly with the Apify platform ecosystem. Connect it to:
- Google Sheets -- automatically push new economic data to a spreadsheet on each run for dashboards and reporting
- Slack / Email -- get notifications when new BLS data is available using Apify webhooks
- Zapier / Make -- trigger downstream workflows whenever the actor finishes a run
- Apify API -- call the actor programmatically from any language using REST endpoints or the official JavaScript/Python clients
- Databases -- pipe structured output directly into PostgreSQL, MySQL, MongoDB, or any database through webhook integrations
- Apify Schedules -- set up automated recurring runs (daily, weekly, monthly) to capture new BLS data releases as they are published
- Other Apify actors -- chain this actor with data transformation or notification actors to build complete economic data pipelines
Related actors from the ryanclinton Apify Store
- FRED Economic Data Search -- access the Federal Reserve Economic Data (FRED) database for 840,000+ US and international economic time series including GDP, interest rates, money supply, and financial market data. The broadest single source of US economic statistics.
- World Bank Development Indicators -- query the World Bank API for global development indicators across 200+ countries, including GDP, population, trade, health, and education metrics. Ideal for international comparisons alongside BLS domestic data.
- IMF Economic Data -- search International Monetary Fund datasets for global macroeconomic statistics, fiscal indicators, and financial data spanning IMF member countries.
- OECD Economic Statistics -- search OECD statistical datasets for economic indicators across member countries, covering employment, trade, finance, and social metrics. Provides international context for BLS US-centric data.