Eurostat Sub-National Statistics — Regional GDP, Jobs, Trends
Pricing
from $2.00 / 1,000 data fetcheds
Eurostat Sub-National Statistics — Regional GDP, Jobs, Trends
Eurostat statistics for the EU's NUTS 2 and NUTS 3 regions: regional GDP per capita (PPS), unemployment and population, with cross-regional comparison, convergence, region screening and economic-twin matching. Plus country GDP, inflation by category and trade.
Pricing
from $2.00 / 1,000 data fetcheds
Rating
0.0
(0)
Developer
Ryan Clinton
Maintained by CommunityActor stats
0
Bookmarked
7
Total users
0
Monthly active users
a month ago
Last modified
Categories
Share
Eurostat EU Regional & Country Statistics
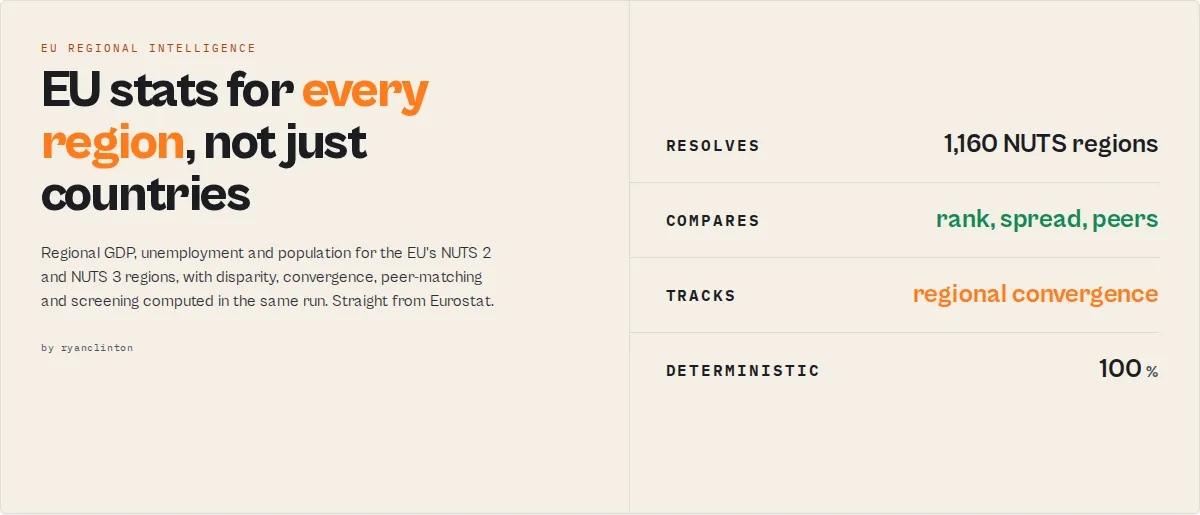
Pull EU statistics at the sub-national region level from Eurostat, the official statistical office of the European Union. This actor returns GDP per capita, unemployment and population for the EU's ~240 NUTS 2 and ~1,160 NUTS 3 regions, not just one number per country. It then computes a cross-regional disparity summary in the same run, so you see the gap between the strongest and weakest region without any downstream maths.
Regional granularity is the point. World Bank, IMF and OECD publish economic data at country level only. Eurostat is the source that goes inside the country, down to Oberbayern, Île-de-France or Lombardy, and this actor is built around that axis: pick a NUTS dataset, pass region codes (or leave them blank for every region), and get analysis-ready records plus a leader/laggard/spread verdict.
It also handles country-level GDP, inflation broken down by spending category (HICP COICOP), population and trade for when you need the national picture or a national-to-regional comparison.
Three things you can do in one run
Find the richest and poorest EU regions. Pick nama_10r_2gdp (or nama_10r_3gdp for ~1,160 small districts), leave the geo field empty, and read the regional-summary record: highest region, lowest region, the spread between them, and how many sit above the EU average.
Track unemployment divergence across regions. Pick lfst_r_lfu3rt, pass a year range, and every region comes back ranked and percentiled in the latest year, plus a regional-trend record per region with the change and CAGR over your window.
Break EU inflation down by spending category. Pick prc_hicp_aind and set coicopCategories to CP01,CP04,CP07 to compare food vs housing/energy vs transport inflation across countries, instead of one all-items number.
Why use this actor
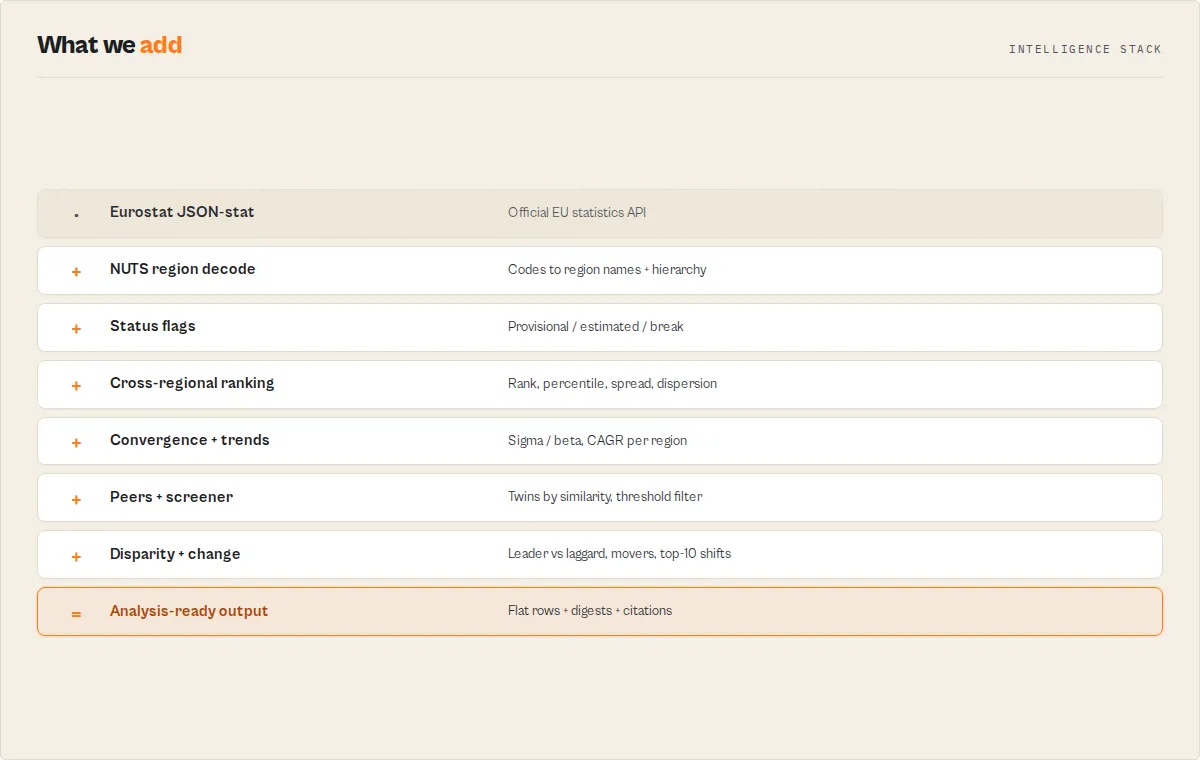
Working with Eurostat's API directly means wrestling with JSON-stat 2.0, a compact positional multi-dimensional format that needs non-trivial index decomposition to decode, plus per-dataset dimension filters that return empty results when wrong. This actor handles the decoding, applies the correct filters for each preset, and resolves NUTS region codes to their real names (DE21 to Oberbayern) automatically.
The differentiator versus the global aggregators is structural, not cosmetic. A country-level GDP figure is a commodity available from a dozen sources. GDP per inhabitant in purchasing-power standards for 1,160 NUTS 3 districts, with the spread between richest and poorest region computed for you, is not, because that data does not exist in the World Bank, IMF or OECD APIs at all.
Running on Apify gives you scheduled monitoring without managing infrastructure. Set up a weekly schedule to track regional convergence, unemployment divergence, or inflation by category across the EU. Every run stores results in a versioned dataset you can query via API, export to CSV, or push to Google Sheets.

Key features
- Sub-national NUTS region data -- Regional GDP per capita in PPS (NUTS 2 and NUTS 3), regional unemployment, and regional population, the granularity the global aggregators do not expose. Pass NUTS codes like
DE21,FR10,ITC4or leave the field blank for every region - Cross-regional disparity summary -- Every run emits a
regional-summaryrecord over the latest period: highest and lowest region, the spread ratio between them, the mean, median, dispersion (coefficient of variation), and how many regions sit above vs below the EU average. Computed deterministically from the data already fetched, no extra request - Inflation by spending category -- Break HICP down by COICOP category (food
CP01, housing/energyCP04, transportCP07, and more) instead of a single all-items index - Nine dataset presets -- Four regional (
nama_10r_2gdp,nama_10r_3gdp,lfst_r_lfu3rt,demo_r_pjangrp3) and five country-level (nama_10_gdp,une_rt_a,prc_hicp_aind,demo_pjan,ext_lt_maineu), each with the correct dimension filters applied automatically - Multi-dataset join -- Pass several dataset codes and get GDP, unemployment and population merged into one wide row per region and period, no downstream join
- Benchmark and discover -- Benchmark any region against its peers (rank, nearest neighbours, closest peers by value), or search the Eurostat catalogue by keyword when you don't know the dataset code
- Custom dataset support -- Query any Eurostat dataset code directly, and pin its dimensions with
dimensionFilters(e.g.,earn_mw_curfor minimum wages with{"currency":["EUR"]}) - Agent-native summary profile -- Set
outputProfile: "summary"to return only the one disparity record, the single object an LLM or dashboard reads without paging - Automatic JSON-stat 2.0 decoding -- Converts positional row-major multi-dimensional data into flat records, resolving NUTS region codes to their real names (DE21 to Oberbayern) and indicator/unit codes to labels
- Geo-level tagging -- Each record carries
geoLevel(country / nuts1 / nuts2 / nuts3 / aggregate) so you can filter regional rows from country and aggregate rows - Time range control -- Narrow to a year range via simple start/end year inputs (1 to 5,000 data points per run)
How to use
Using the Apify Console
- Go to the Eurostat EU Statistics actor page on Apify.
- Click Start to open the input configuration.
- Select a Dataset from the dropdown -- choose from GDP, Unemployment Rate, Inflation/HICP, Population, or EU Trade.
- Optionally enter a Custom Dataset Code to override the dropdown with any valid Eurostat table code. Find codes at the Eurostat Data Browser.
- Enter one or more Country Codes separated by commas (e.g.,
DE, FR, IT, ES). Leave blank to retrieve all available countries. - Set a Start Year and/or End Year to narrow the time range (e.g.,
2018to2023). - Adjust Max Results if needed (default 100, maximum 5,000).
- Click Start and wait for the run to complete (typically 5--15 seconds).
- View results in the Dataset tab. Export to JSON, CSV, Excel, or connect via the Apify API.
Using the API
After the run completes, fetch results from the default dataset:
Input parameters
| Name | Type | Required | Default | Description |
|---|---|---|---|---|
dataset | Select | No | nama_10r_2gdp | Regional: GDP per capita NUTS 2 (nama_10r_2gdp), GDP per capita NUTS 3 (nama_10r_3gdp), unemployment NUTS 2 (lfst_r_lfu3rt), population NUTS (demo_r_pjangrp3). Country: GDP (nama_10_gdp), unemployment (une_rt_a), inflation/HICP (prc_hicp_aind), population (demo_pjan), trade (ext_lt_maineu) |
country | String | No | NUTS sample | Country or NUTS region code(s), comma-separated. Countries: DE, FR. NUTS regions: DE21 (Oberbayern), FR10 (Île-de-France), ITC4 (Lombardy). Add EU27_2020 to benchmark regions against the EU average. Leave empty for all regions |
coicopCategories | String | No | -- | HICP only: comma-separated COICOP codes to break inflation down by category (CP01 food, CP04 housing/energy, CP07 transport). Empty = all-items index |
dimensionFilters | Object (JSON) | No | -- | Advanced: arbitrary Eurostat dimension filters for any dataset, e.g. {"sex":["M","F"],"age":["Y15-24"],"unit":["PC_ACT"]}. Overrides preset values for the same dimension. Find dimension codes in the run log or the Data Browser |
datasets | Array | No | -- | Two or more dataset codes to fetch and join into one wide row per region + period (e.g. regional GDP + unemployment + population side by side). Overrides the single dataset when set |
benchmarkGeo | String | No | -- | A region/country code to benchmark against the rest of the result set: rank, share of regions it beats, nearest higher/lower, and closest peers by value. E.g. DE21 |
mode | Select | No | data | data fetches statistics; discover searches the catalogue; convergence measures regional catch-up; screener filters by criteria; economicTwin finds the most similar region to benchmarkGeo; changeReport lists movers + top-10 entry/exit |
search | String | No | -- | Keyword(s) for mode: "discover". E.g. minimum wages, regional household income. All words must appear in the dataset title or code |
criteria | Object (JSON) | No | -- | For mode: "screener": indicator to threshold, e.g. {"unemploymentRate":"<5","population":">1000000","gdpGrowth":">10"}. Indicators: gdpPpsIndex, gdpGrowth, unemploymentRate, unemploymentChange, population, populationGrowth. Ops: < > <= >= =. A region must match every criterion |
watchlistName | String | No | -- | Name a watchlist to monitor these figures across scheduled runs. Each run is compared against the last run of the same watchlist: observations get changeFlag / previousValue / delta and a watchlist-summary lists the biggest rises and falls. First run captures a baseline |
outputProfile | Select | No | full | full returns observations + the regional-summary record; summary returns only the one disparity record (charged as 1) |
includeRegionalSummary | Boolean | No | true | Emit the cross-regional disparity record (highest/lowest region, spread, dispersion, EU-average comparison) |
customDataset | String | No | -- | Any valid Eurostat dataset code. Overrides the dropdown. Find codes at ec.europa.eu/eurostat/databrowser |
startYear | String | No | -- | Start year (e.g., 2015). Maps to Eurostat's sinceTimePeriod. Empty = earliest available |
endYear | String | No | -- | End year (e.g., 2023). Maps to Eurostat's untilTimePeriod. Empty = latest available |
maxResults | Integer | No | 100 | Maximum data points to return (1--5,000). Pushed in batches of 1,000 |
Example input (regional GDP disparity across NUTS 2 regions):
Tips:
- Leave
countryempty on a regional dataset to retrieve every NUTS region for that level, then read theregional-summaryrecord for the full-EU spread. - Include
EU27_2020alongside region codes to populate theeuAverageblock (how many regions sit above vs below the EU average). - For Greece, Eurostat uses
ELrather than the ISO standardGR. Both are accepted;ELis the Eurostat convention.
Output
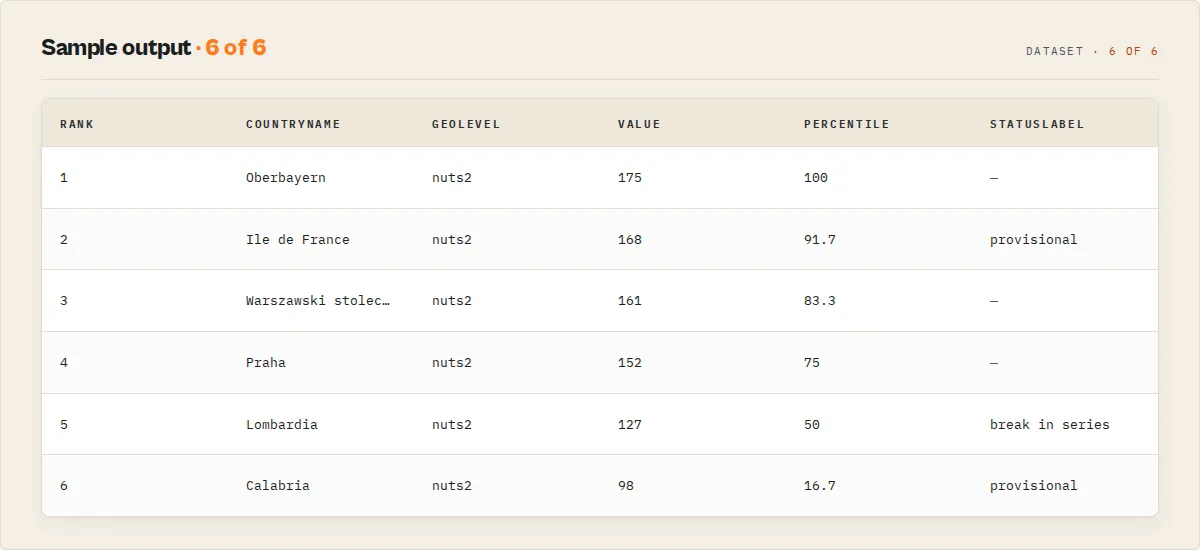
Each run produces a dataset of flat observation records plus, when two or more regions are compared, one regional-summary record. Here is a regional GDP-per-capita example (NUTS 2 regions, GDP per inhabitant in PPS, EU27 = 100):
Each value carries Eurostat's own observation-status flag (statusFlag / statusLabel, with isProvisional / isEstimated / isConfidential booleans) so a provisional or break-in-series figure is never mistaken for final. Regional observations in the latest period are ranked and percentiled, and each geography gets a regional-trend record (change and CAGR over the returned years). The regional-summary carries a coverage map (requested vs returned geographies) and a ready-to-paste Eurostat citation.
Observation record fields
| Field | Type | Description |
|---|---|---|
recordType | String | observation for a data point |
country | String | Country or NUTS region code as used by Eurostat (e.g., DE, DE21, EU27_2020) |
countryName | String | Full region, country or aggregate name (e.g., "Oberbayern", "Germany", "Euro area (20)") |
geoLevel | String | Granularity: country, nuts1, nuts2, nuts3, or aggregate |
countryCode / nuts1 / nuts2 / nuts3 | String | Parent codes derived from the geo code, for joins and roll-ups. null above the geo's own level or for aggregates |
indicator | String | Indicator dimension code, or the dataset code when the dataset has no indicator dimension |
indicatorName | String | Human-readable indicator label |
period | String | Time period -- typically a year (2022); some datasets use quarters or months |
value | Number | The statistical value. Units vary by dataset (PPS index, percentages, EUR, counts) |
unit | String | Unit of measurement label |
statusFlag / statusLabel | String | Eurostat observation-status flag code (p provisional, e estimated, b break, c confidential, d definition differs, u low reliability) and its label. null when unflagged |
isProvisional / isEstimated / isConfidential | Boolean | Convenience booleans derived from statusFlag |
rank / percentile | Number | Cross-regional rank (1 = highest) and percentile within the latest period; null outside that set |
dataset | String | The Eurostat dataset code queried |
extractedAt | String | ISO 8601 extraction timestamp |
Regional-trend record fields (one per geography, when the run spans two or more periods)
| Field | Type | Description |
|---|---|---|
recordType | String | regional-trend |
geo / name | String | Geography code and name |
startPeriod / endPeriod | String | First and last period in the returned range |
startValue / endValue | Number | Values at the start and end period |
absoluteChange | Number | endValue - startValue |
percentChange | Number | Percent change start to end. null when start is 0 |
cagr | Number | Compound annual growth rate (percent). null when periods aren't years or start ≤ 0 |
Regional-summary record fields
| Field | Type | Description |
|---|---|---|
recordType | String | regional-summary |
count | Integer | Number of geographies compared (aggregates excluded) |
highest / lowest | Object | The highest- and lowest-value geography { geo, name, value }. Value-neutral: for unemployment, highest is the worst region, not the best |
spreadRatio | Number | Highest value / lowest value. null when the lowest is not positive |
mean / median | Number | Central tendency across the compared geographies |
dispersion | Number | Coefficient of variation (stdev / mean) -- how unequal the regions are |
euAverage | Object | Present when an EU/euro-area aggregate is in the set: { geo, value, aboveCount, belowCount } |
coverage | Object | { requestedGeos, returnedGeos, missingGeos } — what you asked for vs what came back |
source / sourceUrl / citation | String | Eurostat provenance and a ready-to-paste citation string |
summary | String | Plain-English one-line read of the disparity, quotable in a report or alert |
A run-level SUMMARY object (dataset, record count, period range, and the regional summary) is also written to the run's key-value store for dashboards that want one object without paging the dataset.
Advanced modes
Join multiple datasets in one run
Pass two or more dataset codes in datasets and the actor fetches each and merges them into one wide row per region and period, so GDP, unemployment and population sit side by side with no downstream join.
Each joined row carries geo, geoName, geoLevel, period and one numeric column per dataset (gdpPpsIndex, unemploymentRate, population). A dataset that fails or returns nothing leaves its column null rather than failing the run. Charged once per joined row.
Benchmark a region against its peers
Set benchmarkGeo to get a benchmark record for that region: its rank, the share of regions it beats, its nearest higher and lower neighbours, and its closest peers by value, all on the chosen indicator.
This answers "what regions are most like Munich on GDP per capita?" deterministically, by value proximity, with no AI.
Convergence — are poorer regions catching up?
Set mode to convergence over a year range to answer the core EU cohesion question. The actor returns one convergence record with sigma-convergence (is the gap between regions shrinking?), beta-convergence (are poorer regions growing faster?), and the lists of catching-up vs falling-behind regions. Both are standard econometric definitions, not a weighted score.
Screener — find regions matching your criteria
Set mode to screener and pass criteria to filter Europe's regions like a stock screener. You set the thresholds; the actor fetches the relevant datasets, computes levels and growth, and returns the regions that match every criterion. For a full-EU screen, raise maxResults (the screener fetches all regions unless you pass a country list).
Economic twin — the region most like yours
Set mode to economicTwin and benchmarkGeo to a region. The actor compares it against every region across GDP per capita, unemployment and population (or your own datasets), z-score-normalises each indicator so they're comparable, and returns the most similar regions by distance. The normalisation method is stated on the record, not hidden.
Change report — what moved
Set mode to changeReport over a year range to get the biggest improvers and decliners, plus which regions entered or dropped out of the top 10, between the two most recent periods. One fetch, no prior run needed.
Discover dataset codes
Don't know the code? Set mode to discover and search to a keyword. The actor searches the Eurostat catalogue and returns matching dataset codes with their titles and coverage years.
Monitor across runs
Set watchlistName and schedule the actor. Each run is compared against the last run of the same watchlist: every observation gains a changeFlag (NEW / VALUE_UP / VALUE_DOWN / UNCHANGED), its previousValue and delta, and a watchlist-summary record lists the biggest rises and falls since last run. Eurostat revises figures regularly, so this surfaces revisions and new releases as they land. The first run captures a baseline and says so.
Beyond the presets
The nine presets cover the common economic indicators, but the actor can query thousands of Eurostat datasets. Pass any dataset code in customDataset and pin its dimensions with dimensionFilters:
If a custom query comes back empty, the run log prints the dataset's available dimensions and sample codes so you can correct the filters.
Who uses this?
- Economic development agencies -- Find regions comparable to yours (
economicTwin), and track whether your region is converging with or diverging from the EU (convergence). - Investors and site selection -- Screen Europe's regions for growth, low unemployment and population thresholds in one run (
screener); benchmark a target region against its peers. - Consultants -- Benchmark regions, produce league tables, and pull joined GDP + labour + demographic tables without ETL.
- Journalists -- Surface the biggest regional winners and losers and top-10 movers with
changeReport. - Researchers -- Access raw NUTS data with status flags and citations, plus convergence metrics, for econometric work.
Use cases
- European economic dashboards -- Pull GDP, unemployment, and inflation data on a schedule to power live dashboards tracking EU economic performance across member states
- Academic research -- Retrieve multi-year time series for econometric analysis, EU convergence studies, or comparative policy research without manual data downloads
- Consulting benchmarks -- Compare national economic indicators across EU countries for market entry analysis, investment reports, or competitive positioning studies
- Inflation monitoring -- Track HICP annual average index values across Euro area countries to monitor price stability and divergence from ECB targets
- Trade analysis -- Analyze EU import patterns with main trading partners using the
ext_lt_maineudataset to identify supply chain dependencies and trade flow shifts - Demographic planning -- Access population data from
demo_pjanto support workforce planning, market sizing, or social policy analysis across EU regions - AI and ML pipelines -- Feed structured macroeconomic context into machine learning models, LLM-based research agents, or automated report generation systems
- Journalism and data storytelling -- Extract official EU statistics for fact-checking, data-driven articles, or interactive visualizations comparing economic outcomes across European nations
- Regulatory compliance -- Monitor economic thresholds relevant to EU regulatory frameworks such as Maastricht criteria (deficit, debt, inflation convergence)
- Investment research -- Track leading indicators across European markets to inform portfolio allocation, sector analysis, or country risk assessments
API & integration
Python
JavaScript
cURL
This actor integrates with all standard Apify platform connections including Zapier, Make (formerly Integromat), Google Sheets, Slack, and GitHub Actions. Use webhooks to trigger downstream workflows whenever a run completes, or chain it with other actors in an Apify pipeline.
How it works
-
Input parsing -- The actor reads your configuration and determines which dataset to query. If a
customDatasetcode is provided, it overrides the dropdown selection. Country codes are split on commas and normalized to uppercase. -
URL construction -- A request URL is built against
https://ec.europa.eu/eurostat/api/dissemination/statistics/1.0/data/{datasetCode}. For preset datasets, optimized dimension filters are appended automatically (e.g.,unit=CP_MEUR&na_item=B1GQfor GDP). Country codes become repeatedgeo=parameters. Time ranges map tosinceTimePeriodanduntilTimePeriod. -
API request -- A single HTTP GET request is made to the Eurostat REST API. The response is in JSON-stat 2.0 format -- a compact representation where values are stored in a flat object keyed by positional index.
-
JSON-stat 2.0 decoding -- The actor decomposes each flat index into per-dimension coordinates using row-major order with precomputed multipliers. For each value, it identifies the geographic entity, time period, indicator, and unit by mapping coordinates back to category codes and labels.
-
Record assembly -- Decoded coordinates are combined with human-readable country names (from an internal map of 50+ codes), indicator labels, and unit descriptions into flat
StatisticOutputrecords. -
Batch output -- Records are pushed to the Apify dataset in batches of 1,000 for efficient memory usage, up to the configured
maxResultslimit. -
Summary logging -- The actor logs a breakdown of results by country, the period range covered, and min/max value statistics to help you verify the output at a glance.
Performance
| Metric | Details |
|---|---|
| Run time | A few seconds for a typical query. Larger result sets take longer to decode and stream |
| Memory | Runs in 256 MB. Data is processed in memory with batched output |
| API calls | One HTTP request to the Eurostat dissemination API per run, with bounded retry on transient errors. No key required |
| Billing | Pay-per-event: charged per observation row returned. The derived regional-trend and regional-summary records, and the summary output profile beyond its single record, are not charged per observation |
Limitations
- Preset filters cover the nine built-in datasets -- The actor auto-applies the correct dimension filters for the four regional and five country presets. Custom dataset codes are fetched without preset filters, which may return empty or overly broad results if the dataset requires specific dimension values.
- Maximum 5,000 results per run -- The actor caps output at 5,000 data points. NUTS 3 datasets have ~1,160 regions, so wide queries hit the cap quickly; narrow by region list or time range, or read the
regional-summaryfor the headline. - Disparity summary is cross-sectional, not a forecast -- The
regional-summarycompares regions within the latest period (highest/lowest/spread/dispersion). It does not compute growth rates, trends, or projections; do those downstream. - Custom dimension filters via presets only -- Beyond the built-in presets and the HICP COICOP breakdown, custom dataset codes are fetched with only the geo/time filters; arbitrary dimension filtering (sex, NACE activity, etc.) is not exposed.
- Annual and simple period data -- The preset datasets are annual. Some Eurostat datasets use quarterly or monthly periods; the actor handles them but the period field format will vary (e.g.,
2023Q2,2023M06). - Eurostat API availability -- The actor depends on the Eurostat REST API being online. During Eurostat maintenance windows or heavy load periods, requests may fail or timeout.
- Country code conventions -- Eurostat uses
ELfor Greece rather than the ISO 3166 standardGR. The actor maps both, but some custom datasets may use non-standard codes that are not in the built-in country name map. - No time series aggregation -- The actor returns raw data points. Calculations like year-over-year growth rates, moving averages, or cross-country comparisons must be done downstream.
Responsible use
- Cite Eurostat as the source -- When publishing or redistributing data obtained through this actor, credit Eurostat as the original data provider in accordance with their copyright policy. Eurostat data is generally free to reuse with attribution.
- Respect fair use of the API -- Although the Eurostat API has no formal rate limits, avoid excessive automated querying (hundreds of concurrent requests) that could degrade the service for other users. The actor makes exactly one request per run.
- Do not misrepresent statistical data -- Present extracted values with their correct units, time periods, and contextual metadata. Stripping unit or indicator information from results before publication can lead to misleading conclusions.
- Understand data revisions -- Eurostat regularly revises published statistics. Data extracted today may differ from the same query run in the future due to methodological updates or late-arriving national submissions. Always note the extraction date when using the data.
- Check dataset-specific footnotes -- The actor surfaces Eurostat's per-value status flags (
statusFlag/statusLabel, withisProvisional/isEstimated/isConfidentialbooleans). Treat provisional and break-in-series values accordingly, and for critical applications cross-check against the Eurostat Data Browser directly.
Eurostat terms in plain English
You don't need to know these to use the presets, but they help when reading the output or building custom queries.
- NUTS -- The EU's hierarchy of statistical regions. NUTS 1 = major socio-economic areas (e.g. a German federal state), NUTS 2 = basic regions used for cohesion policy (~240 across the EU, e.g. Oberbayern), NUTS 3 = small regions/districts (~1,160, e.g. the city of Munich). Codes nest by length:
DE(country) toDE2(NUTS 1) toDE21(NUTS 2) toDE212(NUTS 3). - PPS -- Purchasing Power Standard. A currency-free unit that removes price-level differences between countries, so GDP per inhabitant is comparable across the EU. The regional GDP preset is indexed to the EU average = 100.
- HICP -- Harmonised Index of Consumer Prices: the EU's standard inflation measure, comparable across member states.
- COICOP -- The classification of consumer spending categories (food, housing, transport, etc.) used to break HICP inflation down by category.
- Sigma / beta convergence -- Two standard measures of whether regions are growing more alike: sigma = the spread between regions shrinking over time; beta = poorer regions growing faster than richer ones.
FAQ
Q: Do I need an API key to use this actor? A: No. The Eurostat REST API is completely free and open. No registration, authentication, or API key is required.
Q: What countries are covered?
A: All 27 EU member states, 4 EFTA countries (Iceland, Liechtenstein, Norway, Switzerland), 9 candidate/associated countries (Albania, Bosnia and Herzegovina, Georgia, Moldova, Montenegro, North Macedonia, Serbia, Turkey, Ukraine), and selected global partners (UK, US, Japan, China). EU aggregate codes like EU27_2020 (EU-27), EA20 (Euro area), EU15 (original 15 members), and EEA31_2020 (EEA-31) are also supported.
Q: Can I query any Eurostat dataset, not just the nine presets?
A: Yes. Enter any valid dataset code in the customDataset field, and use dimensionFilters to pin its dimensions (sex, age, unit, etc.). You can find dataset and dimension codes at the Eurostat Data Browser -- the dataset code appears in the URL (e.g., irt_st_a for short-term interest rates, earn_mw_cur for minimum wages).
Q: Why am I getting empty results for a custom dataset?
A: Many Eurostat datasets require specific dimension filter values to return data. The nine presets apply the right filters automatically; for custom datasets, pass them via dimensionFilters. Check the run log -- it prints all available dimension names and sample category codes so you can see what the dataset expects.
Q: How often is Eurostat data updated?
A: It varies by dataset. GDP (nama_10_gdp) is typically updated quarterly, unemployment (une_rt_a) monthly, population (demo_pjan) annually, and HICP inflation (prc_hicp_aind) monthly or annually depending on the table. Check the Eurostat release calendar for specific schedules.
Q: What is JSON-stat 2.0 and why does it matter? A: JSON-stat 2.0 is the compact data format Eurostat's API returns. Instead of flat rows, it stores values in a positional array indexed across multiple dimensions (country, time, indicator, unit, etc.). The actor decodes this using row-major index decomposition -- converting positional indices back into human-readable dimension coordinates -- so you get flat records instead of raw positional data.
Q: Can I use EU aggregate codes like EU27_2020?
A: Yes. Pass aggregate codes in the country field just like regular country codes. Common aggregates include EU27_2020 (all 27 member states), EA20 (20 Euro area countries), EA19 (19 Euro area pre-Croatia), EU15 (original 15 members), EU28 (pre-Brexit 28), and EEA31_2020 (European Economic Area).
Q: How do I compare data across datasets (e.g., GDP vs. unemployment)?
A: Run the actor separately for each dataset and join the results by country and period in your analysis tool. Each output record includes the dataset field so you can distinguish which query produced which values.
Q: Why does Greece show as EL instead of GR?
A: Eurostat uses EL for Greece (from the Greek name "Ellada") rather than the ISO 3166-1 standard GR. The actor accepts both codes in the input and maps both to "Greece" in the output, but the country field in results will reflect whatever code Eurostat returns (typically EL).
Q: What is the maximum amount of data I can extract? A: Each run can return up to 5,000 data points. For larger extractions, split your query across multiple runs using different country groups or time ranges, then combine the datasets.
Q: Can I schedule this actor to run automatically? A: Yes. Use Apify's built-in scheduler to run the actor daily, weekly, or on any cron schedule. Each run stores results in a new dataset that you can access via the API or push to integrations like Google Sheets or Slack.
Related actors
| Actor | Description | Link |
|---|---|---|
| OECD Economic Statistics | Search OECD statistics for economic indicators across 38 member countries. Pairs well with Eurostat for EU-vs-OECD comparisons | OECD Economic Statistics |
| World Bank Development Indicators | Access development indicators for 200+ countries. Compare EU metrics against global benchmarks | World Bank Indicators |
| FRED Economic Data Search | Query the Federal Reserve Economic Database for US and international economic time series. Ideal for transatlantic analysis | FRED Economic Data |
| IMF Economic Data | Search IMF databases for global macroeconomic statistics including World Economic Outlook forecasts | IMF Economic Data |
| ECB Exchange Rates | Retrieve European Central Bank exchange rates for EUR against major currencies. Complements Eurostat trade data | ECB Exchange Rates |
| BLS US Economic Data | Search the Bureau of Labor Statistics for US employment, prices, and productivity data for cross-Atlantic benchmarking | BLS Economic Data |