
Google Maps Competitor Density Mapper
Pricing
$3.00 / 1,000 grid cell results
Google Maps Competitor Density Mapper
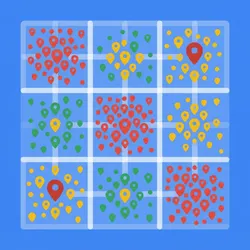
Map competitor density for any business category across a city or neighborhood — grid-sampled counts, ratings, and top players per area.
Pricing
$3.00 / 1,000 grid cell results
Rating
0.0
(0)
Developer

Andrew
Maintained by CommunityActor stats
0
Bookmarked
2
Total users
1
Monthly active users
a month ago
Last modified
Categories
Share
Grid-search any city, neighborhood, or trade area on Google Maps for a business category and get a competitor count for every cell — a point-in-time density snapshot you can pivot into a heatmap. See exactly where a category clusters, where it's thin, and who the top-rated players are in each pocket of the map.
What you get
- One row per grid cell (not one row per place) —
cellRow,cellCol,cellLat,cellLngso you can plot or pivot straight into a heatmap placeCount— number of matching businesses found in that cell (a density signal, sampled up to 40 per cell — not an exhaustive per-cell scrape)avgRatingandavgReviewCount— how mature/competitive that pocket of the market istopPlaces— the top 5 businesses in the cell by review count (name,rating,reviewCount,address), so you can see who dominates each areacategoryandsearchedAton every row for easy filtering across runs
Use cases
- Site selection — find the gaps between existing locations before committing to a new address
- Franchise expansion research — rank candidate territories by how saturated or underserved they already are
- Competitive market research — map where a competitor category clusters across a city instead of guessing from a handful of manual searches
- Sales-territory planning — size and prioritize territories by competitor count and market maturity (ratings, review volume)
This is a point-in-time snapshot, not an ongoing monitoring tool — each run reflects the area as Google Maps shows it at that moment. Run it again later if you want a fresh read; the actor does not track changes between runs.
How to use
- Enter a Business category — e.g.
coffee shops,dentists,car washes. - Set the search area either by typing a Location (e.g.
Chicago, IL) or by entering Center latitude/Center longitude directly. - Set Radius (km) — how far the grid extends from the center in each direction (default 5).
- Set Grid size — the grid is Grid size × Grid size cells (default 3 = 9 cells; max 7 = 49 cells).
- Run — one row per grid cell streams into the Dataset tab. Export as CSV/Sheets and pivot
placeCountbycellRow/cellColto build a heatmap.
Output format
Each dataset record is one grid cell:
Pricing
Pay per grid cell analyzed and saved to the dataset — a 3×3 run costs 9 events, a 5×5 run costs 25 events, and so on. No charge for cells that error out or get skipped.
FAQ
Is this a rank tracker or ongoing monitoring tool? No. Each run is an independent snapshot of the area at run time. Run it again whenever you want a fresh read.
What does placeCount mean exactly? It's the number of matching businesses Google Maps returns for that cell, sampled up to 40 results (two pages) per cell. It's a density signal for comparing cells against each other, not a guaranteed exhaustive count of every business in that cell.
Can I cover a whole metro area? Yes — increase Radius (km) and Grid size together. Grid size is capped at 7×7 (49 cells) per run to keep run time and cost predictable; for a very large area, increase the radius per cell instead of only the grid size.
Do I need a Google API key? No.


