

📈 CNN Fear & Greed Index Scraper — Market Sentiment
Pricing
from $0.0015 / item scraped
📈 CNN Fear & Greed Index Scraper — Market Sentiment
Scrape the CNN Fear & Greed Index: current market-sentiment score and rating, a full historical timeline, and all seven component indicators. Clean structured JSON, CSV or Excel for trading signals, backtesting, dashboards and alerting.
Pricing
from $0.0015 / item scraped
Rating
0.0
(0)
Developer

hiper soft
Maintained by CommunityActor stats
0
Bookmarked
4
Total users
1
Monthly active users
5 days ago
Last modified
Categories
Share
CNN Fear & Greed Index Scraper — Market Sentiment Score, History & Components
Scrape the CNN Fear & Greed Index as clean, structured JSON, CSV, Excel or XML: the current market-sentiment score and rating, a full historical timeline of daily readings, and every one of the component indicators behind the index. Track whether the market is in fear or greed, chart sentiment over time, and feed it straight into trading signals, dashboards and alerts. Fast and reliable, with no account to manage.
What does CNN Fear & Greed Index Scraper do?
This CNN Fear & Greed Index scraper turns market-sentiment data into a structured dataset. In one run it returns the headline index (score from 0–100 and its rating, from extreme fear to extreme greed), the day-by-day historical timeline for roughly the last year, and the current reading of each component indicator that drives the index. Use it to power sentiment dashboards, backtest strategies, build trading signals and monitor mood swings in the market, then export the results in any format the Apify platform supports.
What data can you scrape from the CNN Fear & Greed Index?
| Data point | Description |
|---|---|
| Current score | Latest Fear & Greed Index value, 0 (extreme fear) to 100 (extreme greed). |
| Current rating | Sentiment label: extreme fear, fear, neutral, greed or extreme greed. |
| Timestamp | When the current reading was published (ISO-8601). |
| Previous close | The index value at the previous close. |
| Previous 1 week | The index value one week ago. |
| Previous 1 month | The index value one month ago. |
| Previous 1 year | The index value one year ago. |
| Historical timeline | One row per day: date, score and rating over the history window. |
| Component score | Current score for each indicator that makes up the index. |
| Component rating | Fear/greed rating for each component indicator. |
| Component name | Human-readable name of each indicator (e.g. Market Momentum, Safe Haven Demand). |
The component indicators
The index is a composite of several market signals, and this scraper exposes each one's current reading:
- Market Momentum — the S&P 500 versus its moving average.
- Stock Price Strength — stocks hitting highs versus lows.
- Stock Price Breadth — trading volume in rising versus falling stocks.
- Put and Call Options — the balance of bearish versus bullish options.
- Market Volatility — the VIX and its moving average.
- Junk Bond Demand — the spread between junk and investment-grade yields.
- Safe Haven Demand — the return on stocks versus Treasuries.
Use cases
- Trading signals — turn extreme-fear or extreme-greed readings into buy/sell triggers.
- Backtesting sentiment — join the historical timeline with price data to test contrarian strategies.
- Market dashboards — display a live fear/greed gauge alongside your other market widgets.
- Alerting — notify a channel when the index crosses a threshold or flips fear ↔ greed.
- Research & reporting — study how sentiment moved around events, earnings or selloffs.
- Component analysis — break the headline number down into its underlying indicators.
- Dataset building — feed structured sentiment data into BI tools, notebooks or models.
How to scrape CNN Fear & Greed Index data
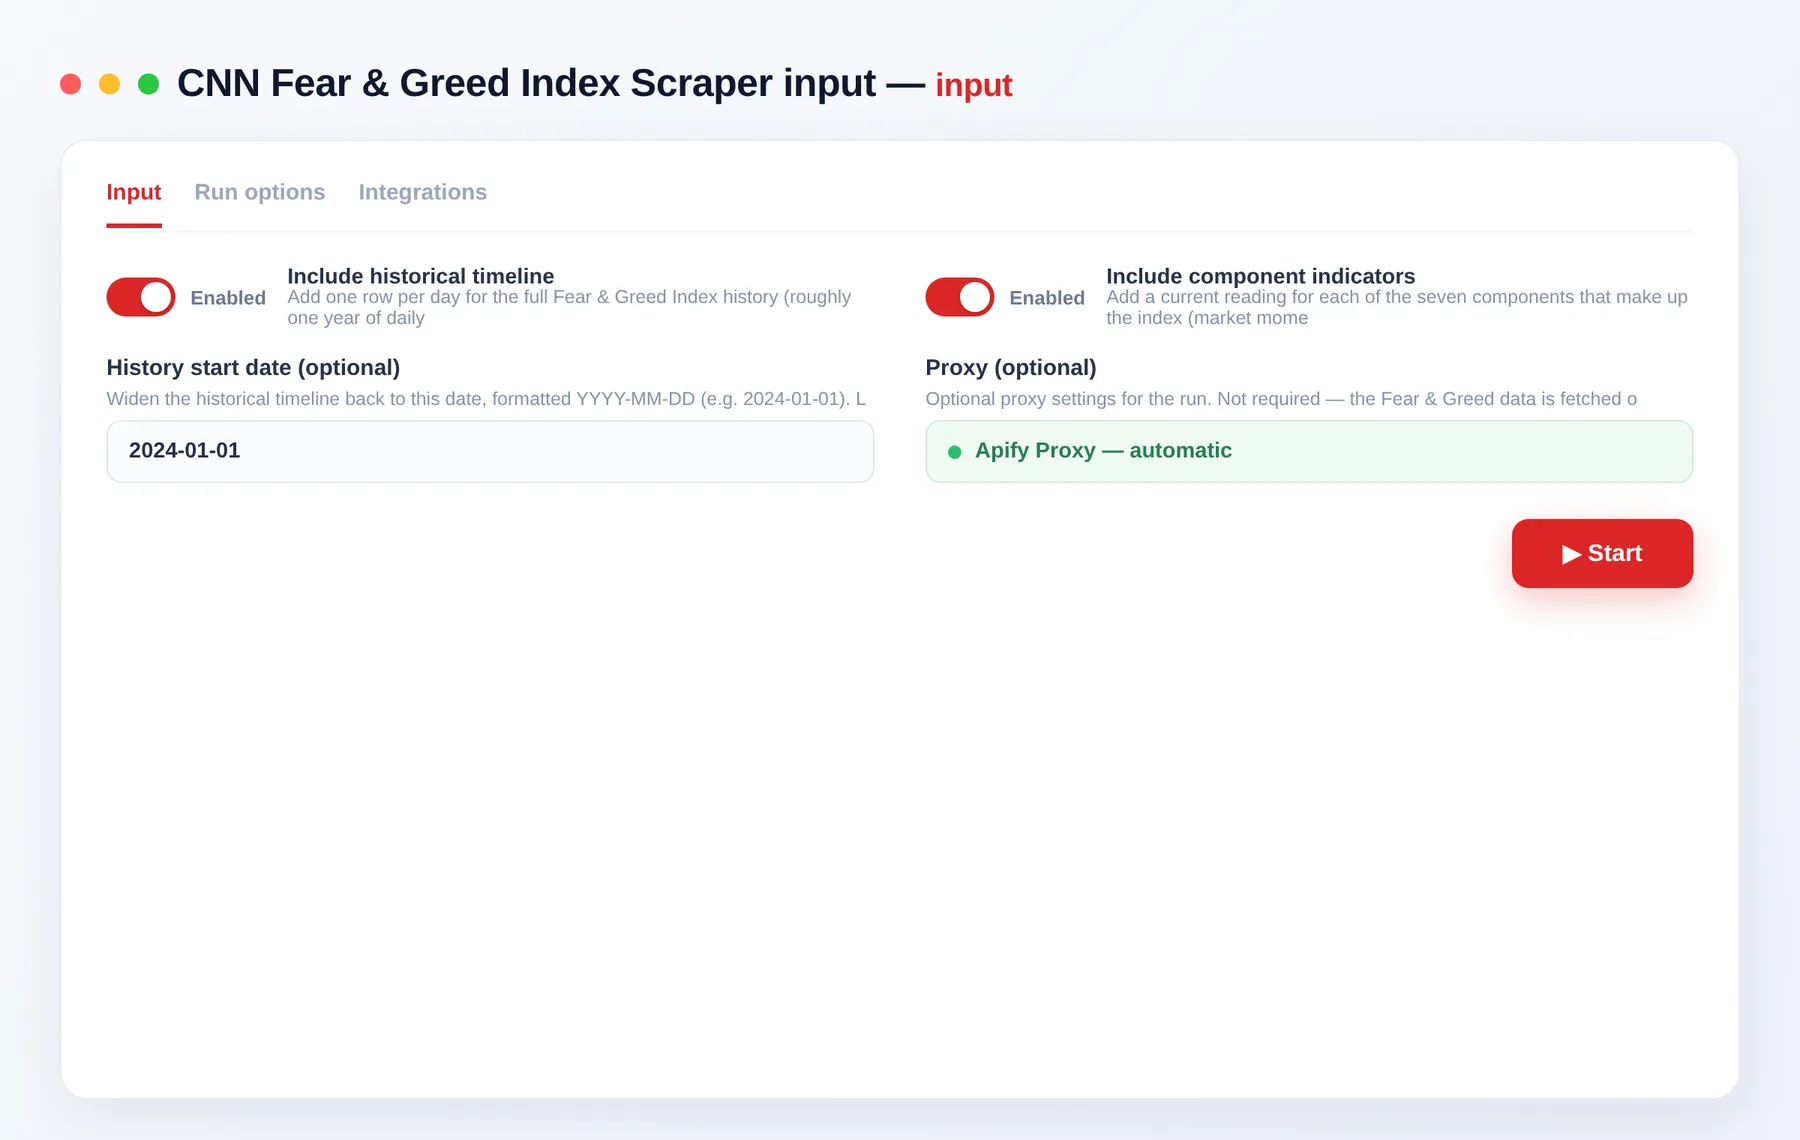
- Add CNN Fear & Greed Index Scraper to your Apify account and open its input.
- Keep Include historical timeline on for the day-by-day history, or turn it off for just the current index.
- Keep Include component indicators on to also get each underlying signal's current reading.
- Optionally set a History start date (YYYY-MM-DD) to widen the timeline further back.
- Click Run, then export the results as JSON, CSV, Excel or XML, or fetch them through the Apify API.
Input
| Field | Description |
|---|---|
includeHistorical | Add one row per day for the full index history (about a year of daily readings). |
includeComponents | Add a current reading for each component indicator behind the index. |
startDate | Optional. Widen the historical timeline back to this date, formatted YYYY-MM-DD. |
proxyConfiguration | Optional Apify proxy settings for the run (not required). |
Output
The dataset mixes three row types, each tagged with a type field so you can filter them apart: one index row, many historical rows, and one component row per indicator.
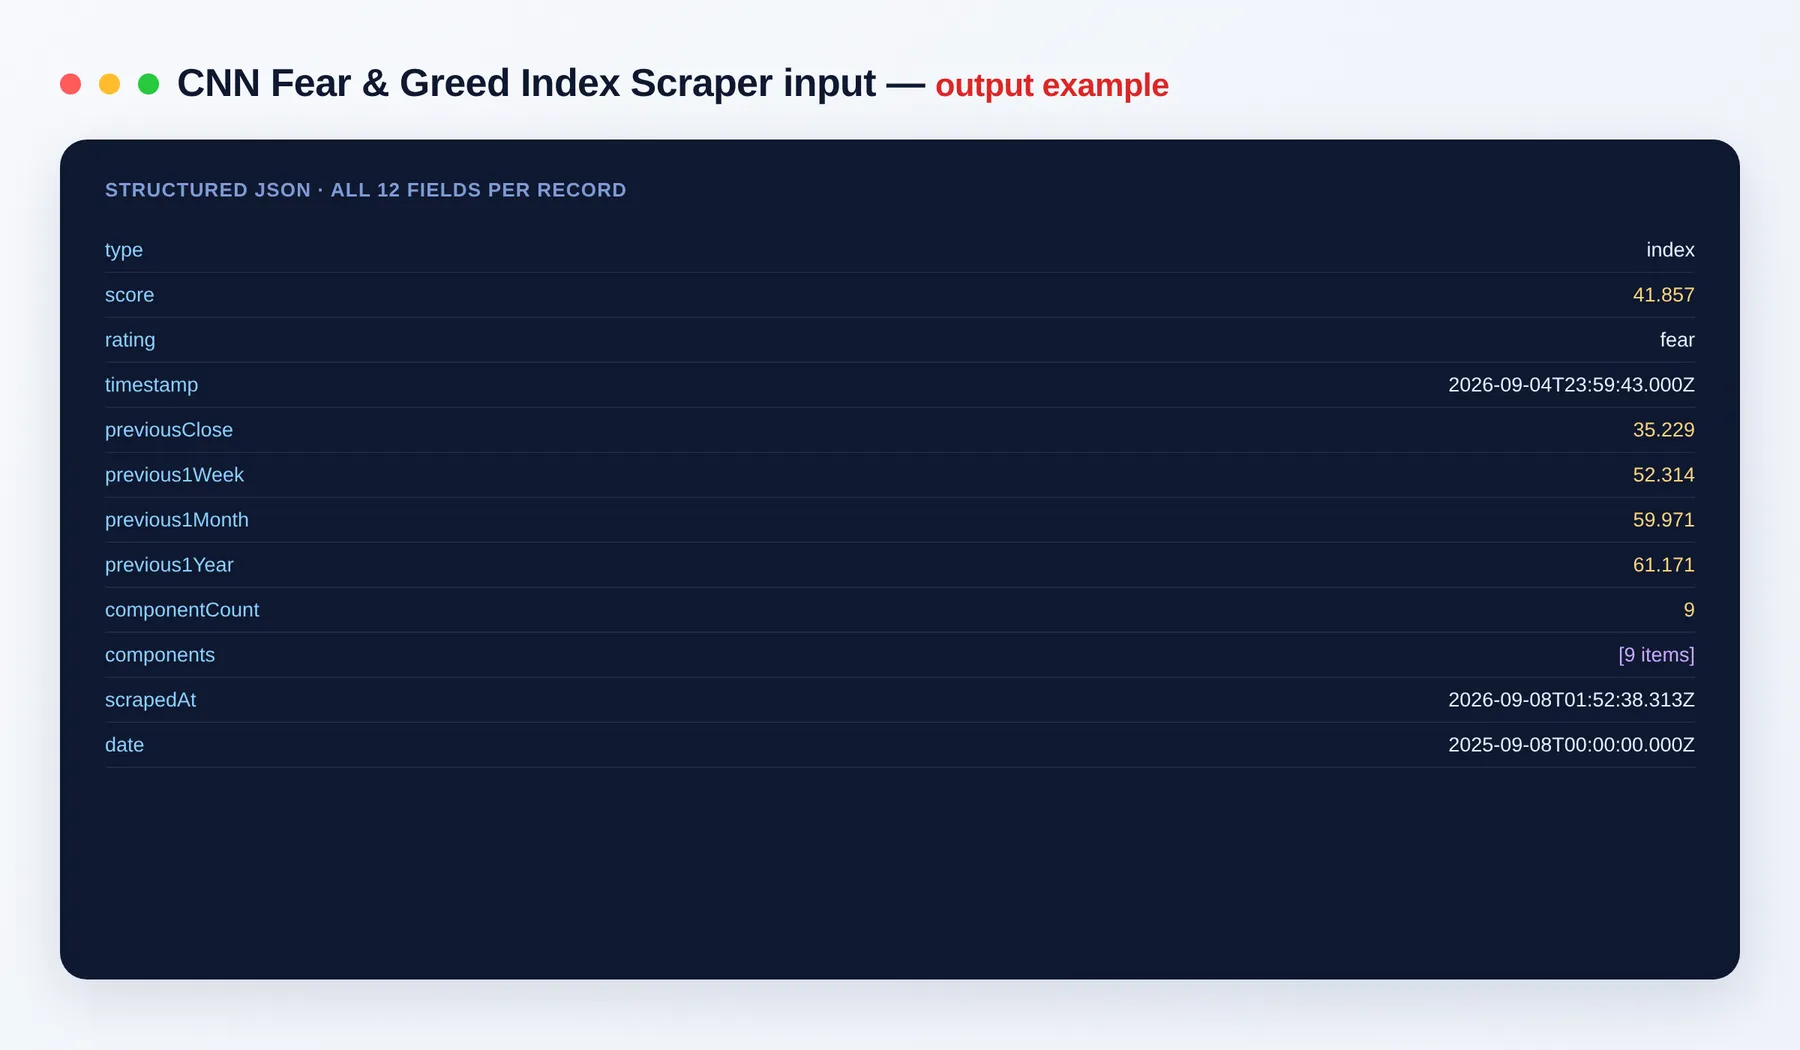
Current index (type: "index")
Historical point (type: "historical")
Component reading (type: "component")
Output schema
| Field | Type | Description |
|---|---|---|
type | string | Row type: index, historical or component. |
score | number | Sentiment score, 0 (extreme fear) to 100 (extreme greed). |
rating | string | Sentiment label: extreme fear, fear, neutral, greed or extreme greed. |
timestamp | string (ISO date) | When the reading was published (index and component rows). |
date | string (ISO date) | Date of a historical daily reading. |
name | string | Human-readable component name (index summary and component rows). |
component | string | Machine key of the component indicator (component rows). |
previousClose | number | Index value at the previous close (index row). |
previous1Week | number | Index value one week ago (index row). |
previous1Month | number | Index value one month ago (index row). |
previous1Year | number | Index value one year ago (index row). |
componentCount | integer | Number of component indicators included (index row). |
components | array | Summary array of each component's current score and rating (index row). |
scrapedAt | string (ISO date) | Timestamp when the run collected the data. |
Need more market data?
- CoinGecko Scraper — live crypto prices, market cap, volume and ATH/ATL.
- DefiLlama Scraper — DeFi protocols, yields, chains and stablecoins with TVL and APY.
- Yahoo Finance Scraper — live quotes and OHLCV history for stocks, ETFs, crypto and forex.
- TradingView Screener Scraper — screen stocks and crypto by dozens of technical and fundamental filters.
FAQ
Do I need an account or key? No login or key to manage — just set your inputs and click Run.
What does the score mean?
The index runs 0–100: lower values mean fear (and, at the extreme, panic selling), higher values mean greed. The rating field labels the zone as extreme fear, fear, neutral, greed or extreme greed.
How far back does the history go?
The default timeline covers roughly the last year of daily readings. Set a startDate to widen the window further back.
How fresh is the data? The current index, its comparison points and each component are pulled live at run time; every row carries a timestamp.
What are the component indicators? They are the underlying market signals the headline index blends together — market momentum, stock price strength and breadth, put/call options, market volatility, junk bond demand and safe-haven demand.
What export formats are available? JSON, CSV, Excel and XML, plus programmatic access through the Apify API.
Can I connect this to my other tools? The CNN Fear & Greed Index Scraper can be connected with almost any cloud service or web app thanks to integrations on the Apify platform. It works with Make, Zapier, Slack, Airbyte, GitHub, Google Drive and many more, plus the Apify API, JavaScript/Python clients and MCP. Or use webhooks to trigger an action whenever a run finishes.
Is this official CNN data? The data reflects the public CNN Business Fear & Greed Index, but this actor is an independent tool and is not affiliated with or endorsed by CNN.
Related Actors
Notes
Original clean-room implementation. Returns only public market-sentiment data; you are responsible for compliant use. Not affiliated with CNN; all trademarks belong to their respective owners.


