

PowerPoint Generator: Markdown or JSON to PPTX & PDF Slides
Pricing
Pay per event
PowerPoint Generator: Markdown or JSON to PPTX & PDF Slides
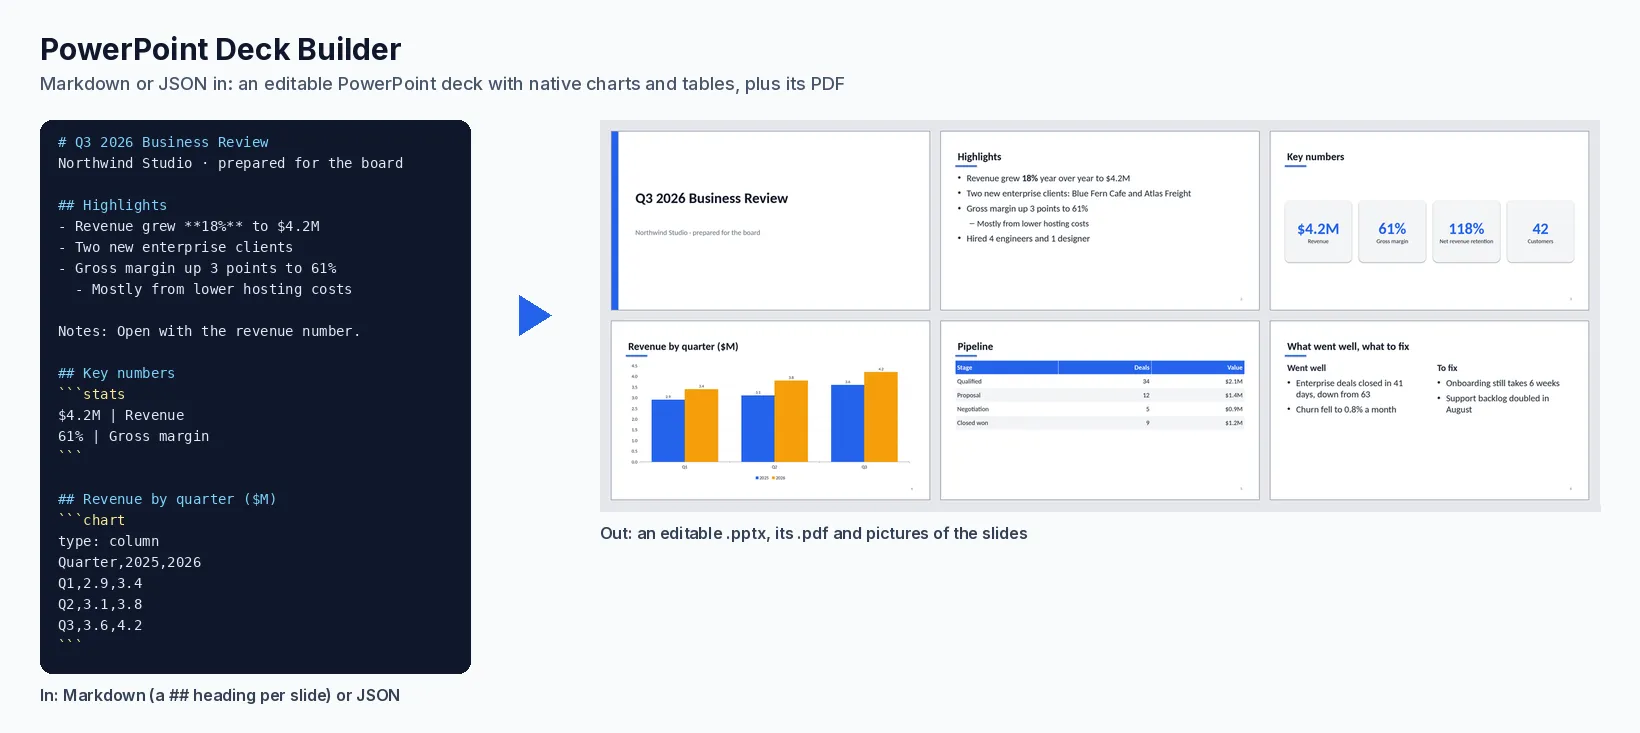
Make editable PowerPoint decks from Markdown or JSON: native charts, styled tables, KPI tiles, images, two columns, quotes and speaker notes, in a built-in theme or your own .pptx/.potx template. Get the .pptx, its PDF and pictures of the slides.
Pricing
Pay per event
Rating
0.0
(0)
Developer

Jumble Mog
Maintained by CommunityActor stats
0
Bookmarked
2
Total users
1
Monthly active users
12 days ago
Last modified
Categories
Security
Limited permissionsShare
Turn Markdown or a JSON list of slides into a real, editable PowerPoint deck. Write a ## heading per slide and get back a .pptx with proper title and body text, native charts you can edit in PowerPoint, styled tables, KPI tiles, images, two-column slides, quotes and speaker notes. You also get its PDF and pictures of the slides. Use one of four built-in themes, or your company's own .pptx or .potx template.
- Editable, not pictures. Titles and bullets are real PowerPoint text. Charts are native PowerPoint charts with their data inside (right-click, Edit Data), and tables are real tables. Anyone can open the deck and keep working on it.
- Your template. Give a link to your company's template, or any deck in its style. The slides use its masters, layouts, fonts and colors, and its own example slides are left out.
- Charts from a few lines. Column, bar, line, pie, doughnut, area and scatter charts, plus stacked column, bar and area and 100% column and bar. Data comes as CSV inside the Markdown or as JSON, with number formats, data labels and axis titles.
- Made to fit. Long text gets a smaller font, and slides with too many bullets or table rows carry on to a "(continued)" slide. KPI values are sized to their tiles.
- PDF and previews. Every deck also comes as a PDF, with an overview picture of the first slides. Optionally there's a PNG of each slide, to check the layout or show a preview.
It's made for:
- AI agents and chat assistants asked to "make me a deck": they write Markdown or JSON, and the user gets a real .pptx back instead of a wall of text.
- Reports that become slides every week or month, such as a business review, a client report or a sprint summary, generated from your data in your company template.
- Apps and no-code flows (Zapier, Make, n8n) that turn a form, a spreadsheet row or a database record into a proposal, a quote deck or a training deck.
- Anyone who'd rather write an outline than push boxes around in PowerPoint.
How to use it
- Write the slides in Markdown (the input form has an example to start from), or give them as JSON.
- Pick a theme, or give your template as a link or an upload. Add a footer, brand colors or a presenter name if you like.
- Click Start. You get a link to the .pptx, the PDF and an overview picture of the slides.
Writing slides in Markdown
| Write | Makes |
|---|---|
# Title and a line under it | The title slide, with that line as the subtitle (a later # makes a section slide). |
## Heading or --- | A new slide. |
- point (indent for sub-points), plain lines | Bullets, or paragraphs. **bold**, *italic*, `code` and [links](https://...) work. |
A pipe table (| a | b |) | A table. Number columns are right-aligned. |
```chart with type:, title:, format:, dataLabels: lines, then CSV | A native chart: the first column is the categories, each other column a series. |
```stats with value | label lines | KPI tiles (up to 8). |
 | An image, fitted to the slide, with its caption. |
> quote and > — Name | A quote slide. |
||| on its own line | Splits the slide into two columns; a ### heading above each column titles it. |
Notes: ... or <!-- ... --> | Speaker notes. |
Slides as JSON
A slide has a title and one of these:
bullets: nested lists for sub-points;text;table: rows of objects, or{"header", "rows"};chart:type,categories,seriesand optionaltitle,numberFormat,dataLabels,legend,xTitle,yTitle;image: a link and an optionalcaption;stats: a list of{"value", "label"}.
Slides can also have notes. Other slide shapes:
{"left", "right"}(each bullets, text or any of the blocks above, with optionalleftTitleandrightTitle) makes two columns;{"quote", "author"}makes a quote slide;{"layout": "section"}makes a divider.
Options
| Field | What it takes |
|---|---|
markdown or slides | The slides. |
title, subtitle, author, date | Add a title slide when the slides don't start with one; author is also saved in the file. |
theme | clean (white and blue), midnight (dark), sand (warm) or slate (cool). |
template | A link to a .pptx or .potx (Google Drive, Dropbox and OneDrive share links work), base64, or an upload in uploads. |
colors | Up to 6 hex colors for accents, charts and tables, replacing the theme's or the template's. |
aspect | 16:9 (default) or 4:3, for the built-in themes. |
slideNumbers, footer | Slide numbers (on by default) and a footer line on every slide but the title slide. |
outputs | ["pptx", "pdf"] (default), or one of them. |
slideImages | true also saves a PNG of each slide (the first 30). |
fileName | The files' name. By default the deck's title. |
requests | More decks in one run (up to 20). Each is Markdown text, a list of slides, or an object with the fields above. |
How-to examples
Each example below is a complete input. The result line is what the run says in summary.
How to convert Markdown to PowerPoint (PPTX)
Result: "Made Weekly update: 3 slides in the slate theme, speaker notes on 1, as PPTX and PDF." You get pptxUrl, pdfUrl and an overview picture.
How to turn spreadsheet data into chart and table slides
Send the numbers as JSON. The chart is a native PowerPoint chart, so it can still be edited in PowerPoint.
Result: "Made Acme Co. monthly report: 3 slides in the clean theme, 1 chart, 1 table, as PPTX." The title slide is added from title and date.
How to make slides in your company's PowerPoint template
Add "template" with a link to your .pptx or .potx (a Google Drive, Dropbox or OneDrive share link works), and leave out theme:
Result: "Made Atlas Freight onboarding plan: 2 slides in the template, as PPTX." The slides use the template's layouts, fonts, colors and master graphics.
How to let ChatGPT, Claude or another AI agent make PowerPoint decks
Add this Actor to the Apify MCP server with https://mcp.apify.com/?tools=jumblemog/pptx-deck-builder. The agent writes the deck as Markdown, sends it in markdown, and gives the user the pptxUrl link. The outline in the result lists every slide, so the agent can check the deck without opening it.
FAQ
Is the PowerPoint editable? Yes. Titles, bullets and tables are real PowerPoint text and tables, and charts are native charts with their data inside (right-click, Edit Data).
Can I use my own template? Yes, any .pptx or .potx. Its example slides are left out and its layouts are used for the new slides.
Does it work with Zapier, Make or n8n? Yes. Call the Actor with its Apify app or an HTTP request, and pass the Markdown or slides from an earlier step.
Can I get a PDF too? Yes. A PDF is made by default; set outputs to ["pptx"] or ["pdf"] for one of them.
Does it make Google Slides? It makes a .pptx file, which Google Slides opens and converts (File > Import slides, or upload it to Drive).
Output
There is one dataset item per deck. They are also saved together in the run's OUTPUT record:
Each item also has the slide-by-slide outline and a Markdown report. It has warnings for anything to check, such as an image that couldn't be loaded (its caption is shown in its place, and the deck is still made). A request that can't be read gives "status": "failed", with an error that says what to change. Failed requests aren't billed.
How it works
- Reading the slides. The Markdown or JSON is read into slides, each with a title and one kind of content (or two columns). Lists that are too long for a slide carry on to the next.
- Laying them out. python-pptx builds the deck.
- In a built-in theme, the deck's own theme colors are set too, so new slides and charts added in PowerPoint match.
- In your template, each slide uses the matching layout (title, section, title and content, two content) and its placeholders, so the template's fonts, positions and master graphics apply.
- Charts are native chart objects with their data in an embedded workbook.
- PDF and pictures. LibreOffice Impress makes the PDF, and PDFium draws the slide pictures from it.
Pricing
You pay one low price per deck, at the price shown on this page. The PDF, the overview picture and the slide pictures are included. Failed requests are never charged. If you set a maximum cost per run, the Actor makes only the decks that fit.
Speed
A 10-slide deck with a chart and a table takes about 2 seconds, PDF included. A run through the API answers in about 10 to 15 seconds for one deck, which includes starting the cloud container and LibreOffice.
Tips and limits
- Templates. Any .pptx or .potx works. Decks made in a template follow its layouts, so a template whose layouts have the usual Title, Section Header, Title and Content and Two Content placeholders looks best. Brand colors in
colorsreplace its accent colors. The PDF and pictures are drawn by LibreOffice, so fonts the template uses but the server doesn't have are replaced by look-alikes. The .pptx keeps the real font names and shows them on your computer. - Images. PNG, JPEG, GIF and BMP go in as they are. WebP and TIFF are converted to PNG. SVG isn't supported, so convert it to PNG first.
- Limits:
- 20 decks per run;
- 200 slides per deck;
- 200 rows per table (split into slides of 14 rows);
- 12 bullets per slide before it continues;
- 50 images per deck, 50 MB per file.
For AI agents and developers
This Actor works with the Apify MCP server, so AI agents can call it as a tool. Write the deck as Markdown, send it in markdown, and give the user pptxUrl (and pdfUrl to preview).
A direct API call that waits for the answer:
run-sync returns the run's OUTPUT instead: the status, the counts and every result as JSON.
In Python, with the apify-client package, here's a client report made from data, in your company template:
Credits
- python-pptx (MIT) writes the PowerPoint files.
- LibreOffice (MPL-2.0) Impress makes the PDFs.
- pypdfium2 (Apache-2.0 or BSD-3-Clause) and Pillow (MIT-CMU) draw the slide pictures.
- The Carlito, Caladea and Liberation fonts (SIL Open Font License) give text the widths of Calibri, Cambria and Arial.


