
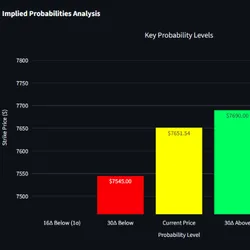
Options Implied Probability & Risk-Neutral Distribution
Pricing
Pay per usage
Options Implied Probability & Risk-Neutral Distribution
Quantitative options implied probability engine: Black-Scholes risk-neutral density, Breeden-Litzenberger PDF/CDF curves, 16Delta (1-Sigma, 68% CI) & 30Delta probability strikes, straddle implied move ranges, and 13-tier target probability matrices.
Pricing
Pay per usage
Rating
0.0
(0)
Developer

khalid naami
Maintained by CommunityActor stats
0
Bookmarked
2
Total users
1
Monthly active users
a day ago
Last modified
Categories
Share
Options Implied Probability & Expected Move Intelligence Actor
Institutional-grade quantitative options analytics actor for calculating Risk-Neutral Probabilities, ATM Straddle Implied Moves, Standard Deviation Confidence Intervals (16-Delta / 30-Delta), and Full Strike-by-Strike Distribution Densities across any US equity, index, or ETF.
🚀 Key Features
- Options Market Implied Move: Calculates exact implied moves ($\pm $$ and $\pm %$) directly from At-The-Money (ATM) Straddle prices ($C_{\text{mid}} + P_{\text{mid}}$).
- Probability of Staying Inside Move: Computes the exact risk-neutral probability of the underlying asset finishing within the upper and lower expected boundaries ($P \in [\text{Lower}, \text{Upper}]$).
- Delta Thresholds & Confidence Intervals:
- 16-Delta (1-Sigma / 68% Confidence Interval): Risk-neutral $+1\sigma$ and $-1\sigma$ target boundaries.
- 30-Delta (0.5-Sigma / 40% Confidence Interval): Intermediate quantitative target boundaries.
- 50-Delta: Risk-neutral median strike ($d_2 = 0$).
- 13-Tier Target Probability Matrix: Maps exact theoretical & nearest market strikes for target probabilities:
10%, 16%, 20%, 25%, 30%, 40%, 50%, 60%, 70%, 75%, 80%, 84%, 90%. - Strike-by-Strike Risk-Neutral Density: Computes Breeden-Litzenberger risk-neutral PDF density $f(K) = \frac{\phi(d_2)}{K \sigma \sqrt{T}}$, Black-Scholes $P(S_T > K) = N(d_2)$, touch probabilities $P_{\text{touch}}$, and option Deltas.
📥 Input Parameters
| Parameter | Type | Default | Description |
|---|---|---|---|
symbols | Array / String | ["SPY", "QQQ", "AAPL", "NVDA", "TSLA"] | List of ticker symbols to analyze. |
riskFreeRate | Float | 0.045 (4.5%) | Annualized risk-free interest rate ($r$). |
includeFullDistribution | Boolean | true | Include full strike-by-strike probability table. |
includeProbabilityMatrix | Boolean | true | Include 13-tier probability level matrix. |
maxExpirationsPerSymbol | Integer | 4 | Maximum number of upcoming expiration cycles to evaluate per symbol. |
📤 Output Structure
1. Default Dataset (Tabular Overview)
Each row represents a specific expiration cycle for an underlying asset:
2. Key-Value Store (OUTPUT)
Contains the full hierarchical JSON structure including:
targetProbabilityMatrix: Detailed distance, nearest strike, and directional bias across 13 probability thresholds.strikeDistribution: Full chain strikes with Delta, IV, $P(\text{Above})$, $P(\text{Below})$, $P(\text{Touch})$, and Risk-Neutral Density.
🎯 Use Cases
- Options Selling & Premium Harvesting: Determine mathematically optimal strike selection for Iron Condors, Credit Spreads, and Short Strangles based on 16-Delta ($1\sigma$) or 10-Delta wings.
- Earnings Implied Move Analysis: Gauge market-expected binary move magnitude vs historical realized moves before quarterly earnings announcements.
- Risk Management & Hedging: Set quantitative stop-loss thresholds and dynamic tail-risk hedges outside the 68% or 90% confidence bands.
- Systematic Trading Algorithms: Integrate institutional probability distributions into quantitative execution bots.


