

Google Trends Scraper — Trending Now, timelines & queries
Pricing
from $0.75 / 1,000 results
Google Trends Scraper — Trending Now, timelines & queries
Google Trends scraper on Google's own JSON API, no browser: interest over time, by region, related queries, compare up to 5 terms, custom date ranges back to 2004, and the live Trending Now board with search volume. Pay per delivered row; a failed fetch is listed in ERRORS, never charged.
Pricing
from $0.75 / 1,000 results
Rating
5.0
(1)
Developer

Muhamed Didovic
Maintained by CommunityActor stats
0
Bookmarked
37
Total users
12
Monthly active users
3 days ago
Last modified
Share
Google Trends Scraper

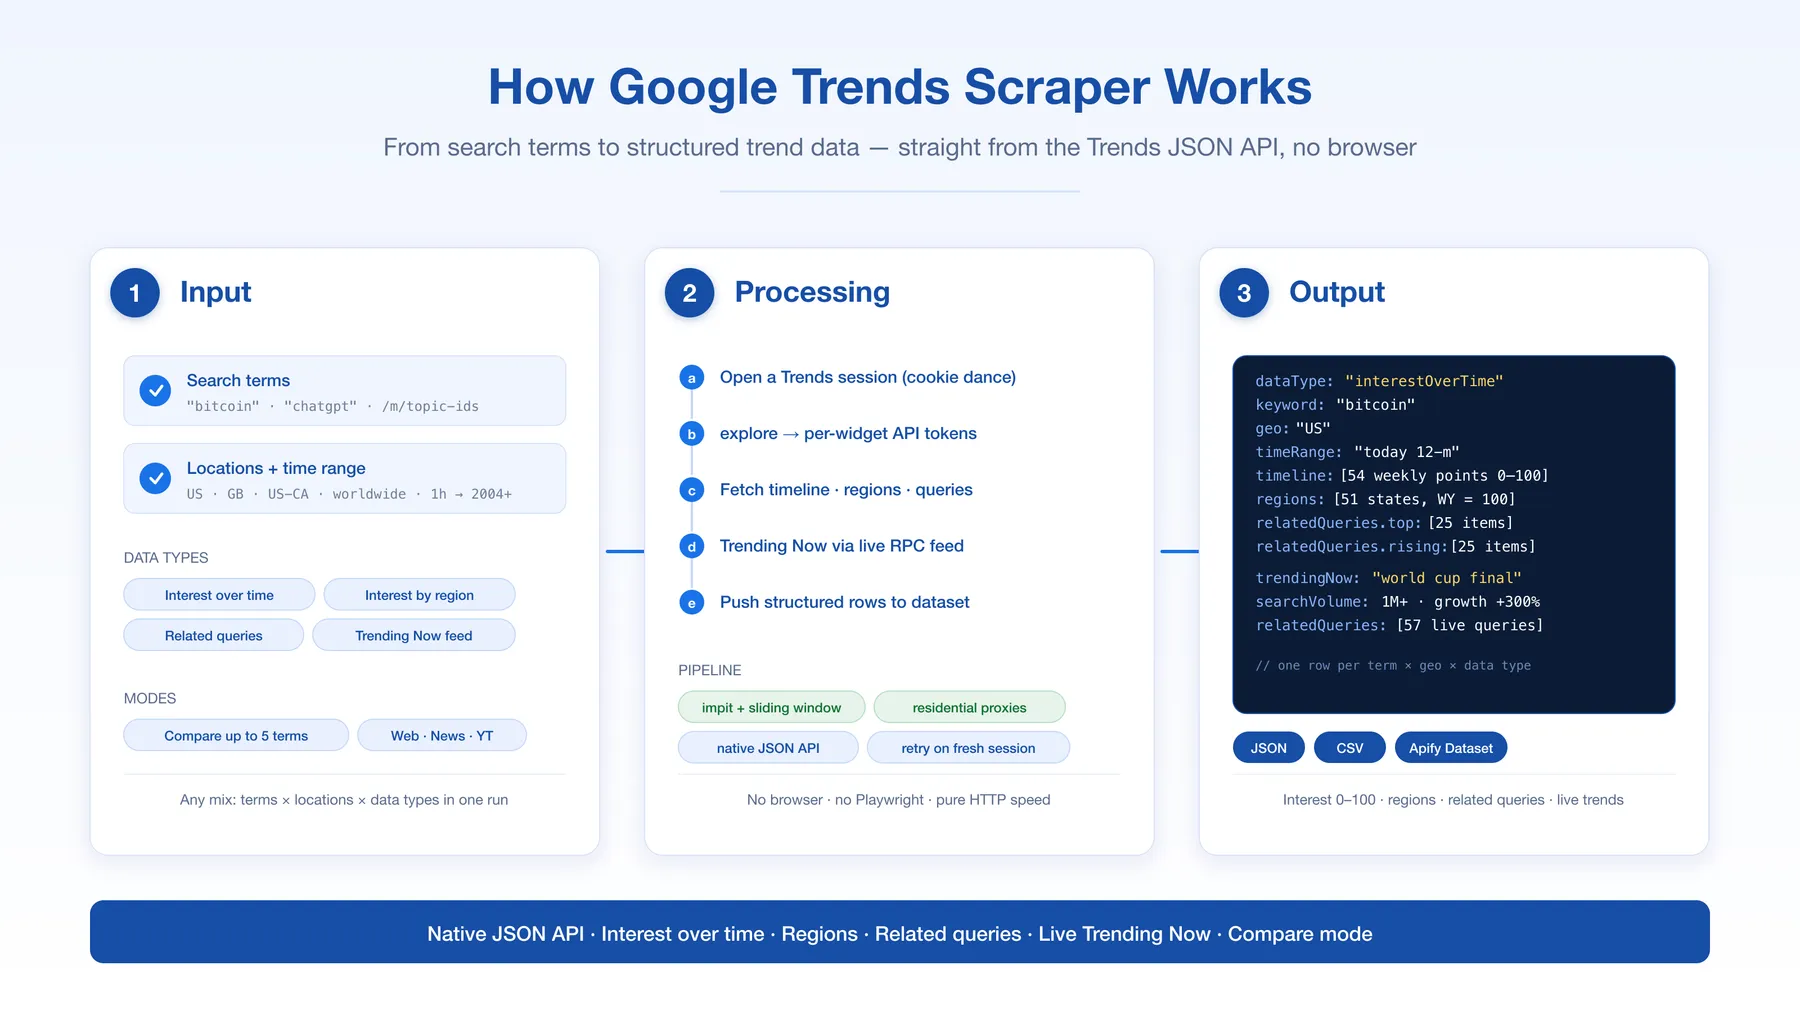
Google Trends as clean JSON: the 0–100 interest over time timeline, interest by region, top + rising related queries, multi-term compare on one shared scale, and the live Trending Now board for any country with search volume, growth % and start time attached. Any term, any country or region, any preset window or a fixed date range back to 2004, on any Google property. Pure HTTP against the same JSON API the Trends site uses, so a run finishes in seconds.
You pay for delivered results. A fetch that fails, is blocked, or comes back empty never becomes a dataset row and is never charged as one. It is named in the run's ERRORS record with the reason and what to change, and the run's status line reconciles the arithmetic: results asked for = results delivered + results reported. The run-stats box on this page is public; check the live success rate yourself.
🔁 Coming from another Google Trends scraper?
Browser-based Trends scrapers load the trends.google.com page and wait for its chart widgets to render. When Google changes that page or slows it down, those runs wait, retry and time out with nothing to show. The complaints on public issue boards are the same few, so here is how this actor handles each one:
| Common complaint | What this actor does |
|---|---|
| "Runs for 10 minutes and returns nothing" / "infinite retry loop" | No browser and no page to render. It calls the JSON endpoints the Trends site itself uses, so a typical run finishes in seconds. A run that keeps getting rate-limited stops retrying and says so. |
| "Fails with no explanation" | Every result that was asked for and not delivered is listed in the run's ERRORS record with a reason and a retryable flag, and the status line reconciles asked = delivered + reported. |
| "Charged for a run with 0 output" | Results are billed per delivered row. A run that delivers nothing costs only the $0.01 run start. |
| "I only need the timeline, not everything else" | Each dataset has its own switch. Turn off regions and related queries and a keyword costs one row. |
| "How do I get a fixed date range?" | customTimeRange: "2024-01-01 2024-06-30", any window from 2004 on. |
| "Locations like UK return errors" | UK is mapped to GB (and a few similar aliases); a value Google rejects is reported as bad input, not as a block. |
Google rate-limits every Trends client, this one included. The difference is what happens next: rate-limited results are retried within limits, named, and not charged, and the run's public success rate is on this page for you to check.
✨ Why use this scraper?
- Live Trending Now feed — the full board for any country (600+ topics per 24 h for the US), each with absolute search volume, growth %, when it started, and its related queries. Most Trends scrapers do not return this at all.
- All four Trends datasets in one run — timelines, region breakdowns, top + rising related queries, and related topics (see the note on topics below).
- Many terms × many countries per run —
searchTermsandgeosare both lists, so one run coversbitcoin/ethereumacrossUS/GB/DE. - Compare mode — up to 5 terms in one request, interest values relative to each other, exactly like the compare view on trends.google.com.
- Every miss is explained, none is billed — a term below Google's volume floor, a rate-limited call, a withheld topics feed: each is a named line in the
ERRORSrecord, never an empty row you paid for. - No browser, no API key, no proxy setup — residential routing is built in; runs finish in seconds.
- Any geo, any window, any property — worldwide, country (
US) or region (US-CA); from the past hour back to 2004; Web, News, YouTube, Images, Shopping. - Self-describing rows — one row per term × location × data type, each carrying its full query context, so CSV exports and downstream joins need no lookup.
🧾 What you pay for, and what you never pay for
One result = one delivered row. A 12-month timeline is one row with every week inside it, a region table is one row, a related-queries set (top + rising) is one row, and the Trending Now board is one row per trending topic. You are billed per row written to the dataset, and only then.
A result that is not delivered is not charged, and it is never silently dropped either. Every one lands in the run's ERRORS record (key-value store) with a reason, a plain-language detail saying what happened and what to change, and a retryable flag:
reason | What happened | Re-run as-is? |
|---|---|---|
no_data | Google answered with nothing measurable: an empty or all-zero timeline or region table, or empty related lists. The term sits below Google's volume floor for that window. | No — widen the time range, drop the region filter, or use a topic id |
topics_gated | Google serves the related-topics feed only to sessions it classifies as regular users; it came back empty. Related queries are unaffected. | No |
rate_limited | Google answered HTTP 429 and the retry budget is spent. | Yes, in a few minutes |
blocked | The token step (/trends/api/explore) never issued widget tokens for this query. | Yes, in a few minutes |
proxy_failed | Our proxy refused the request (HTTP 407). Nothing reached Google; this is on our side. | Yes |
fetch_failed | A transport failure that survived one retry. | Yes |
no_widget | Google's explore response carried no widget for this data type. | Yes |
budget_cap | maxItems was reached before this result's turn. | Raise maxItems |
The run's status line carries the same arithmetic, so a partial result is visible in your run list rather than something you discover in the dataset later:
Delivered 4 of 6 results. 2 not delivered and not charged: 1 no data from Google (below its volume floor), 1 rate-limited by Google — see the ERRORS record; 1 worth re-running in a few minutes.
A timeline with even one measurable week is a delivered result, because Google charted the term and found interest only in those weeks. Every timeline row carries measurablePeriods and totalPeriods, so a sparse timeline explains itself on the row and is never mistaken for a failed fetch.
A run that delivers nothing because of a block or a fault on our side is marked FAILED, with the reason in its status message, so it stands out in your run list and in our alerts. A run that delivers nothing because Google has no data for your terms is a SUCCEEDED run with an empty dataset and a full ERRORS record: nothing went wrong, and the record says exactly which term had nothing in that window.
🎯 Use cases
- SEO & content planning — find rising queries around your topic before the competition writes about them.
- Market & brand research — track how interest in a brand, product, or ticker moves across time and geography.
- Newsrooms & social teams — poll the Trending Now feed on a schedule and catch breaking topics with search-volume and growth numbers attached.
- E-commerce & merchandising — spot seasonal demand curves and regional hot-spots for product categories.
- Investment & alt-data signals — search interest is a leading indicator; pipe timelines into your models as CSV/JSON.
- Academic & social research — reproducible interest data across dozens of geos in one run, with every miss on the record.
📥 Supported inputs
| Input | What it does |
|---|---|
searchTerms | Keywords or Google topic ids (/m/05p0rrx) — each queried independently |
compareKeywords | Compare all terms in one request (groups of ≤5, relative 0–100 scale) |
geos | US, GB, DE, US-CA, … or empty string for worldwide — every term is queried per geo |
timeRange | now 1-H → all (2004–present), same windows as the Trends UI |
customTimeRange | Fixed window YYYY-MM-DD YYYY-MM-DD (from 2004-01-01); replaces timeRange when set |
property | Web Search (default), Images, News, YouTube, Shopping |
category | Trends category id to narrow results (0 = all) |
includeInterestOverTime | Interest timeline — on by default |
includeInterestByRegion | Geographic breakdown by country/subregion — on by default |
includeRelatedQueries | Top + rising related search queries — on by default |
includeRelatedTopics | Top + rising related topics (entities) — off by default, see FAQ |
trendingNow + trendingNowGeo + trendingNowHours | Live Trending Now feed per country, 4 h–7 d window |
maxItems | Hard cap on rows produced, and therefore on run cost; what it stops is reported as budget_cap |
🔄 How it works
- The actor opens a Trends session through built-in residential routing and performs the token handshake the web app uses.
- For every term × location, one
explorecall issues per-widget API tokens. If that call fails, it is retried on a fresh session up tomaxRequestRetriestimes. - The requested datasets are fetched with those tokens, one at a time with a short gap, in the order timeline → regions → related queries → related topics. A widget Google rate-limits is retried once; a whole run that keeps hitting 429s stops retrying rather than spending more of a quota that is already gone. Paying users also get a paid fallback network for rate-limited widget calls, capped per run.
- Trending Now is fetched from the live RPC feed the new Trends UI uses — search volume, growth %, start time, and related queries included.
- Each delivered dataset is normalized and pushed as one row. Everything else is written to the
ERRORSrecord, and the run's status line reconciles the two.
⚙️ Input parameters
To pull a fixed window instead of a preset, set customTimeRange to "2024-01-01 2024-06-30". Google chooses the timeline resolution from the window length: daily points for a few months, weekly or monthly for longer windows. A malformed or reversed range stops the run at once with an input error, before anything is fetched.
📊 Output overview
One row per term × location × data type, plus one row per trending topic when the Trending Now feed is enabled. Every row carries the query context (keyword, geo, timeRange, category, property, exploreUrl) so it is self-describing in CSV exports.
Alongside the dataset, every run writes an ERRORS record to its default key-value store — an empty items list on a clean run, so your integration can read it unconditionally.
💵 What a run actually costs
You are billed one result per dataset, not one result per data point. A 5-year weekly timeline is a single row with 260 points inside it, not 260 billed rows. The same holds for a region breakdown (every region in one row) and a related-queries set (top + rising in one row).
You only pay for the datasets you switch on. Want just the timeline? Turn the other three off and a keyword costs one row instead of four. Nothing is bundled into a mandatory all-in-one result. maxItems puts a hard ceiling on top of that, and Apify's Maximum cost per run caps the spend in dollars.
At $0.00075 per delivered result plus a $0.01 run start (the only fixed cost; charged once per run, including a run that delivers nothing):
| Run | Rows | Cost |
|---|---|---|
| 1 term × 1 country, 3 core datasets | 3 | ~$0.012 |
| 3 terms × 2 countries, 3 core datasets | 18 | ~$0.024 |
| 5 terms × 5 countries, 3 core datasets | 75 | ~$0.066 |
| Trending Now board, US, 24 h, top 100 | 100 | ~$0.085 — set maxItems to take just the top N |
These are ceilings: a result Google has no data for, a rate-limited call, or a withheld topics feed costs $0. The Trending Now feed is deep (600+ topics for a large country in a 24 h window), so maxItems doubles as your spend cap — rows come back rank-ordered, so maxItems: 25 gives you the top 25.
📦 Output sample
Interest over time:
Related queries:
Trending Now:
The ERRORS record, from a run that asked for a real term and a term Google has never charted:
🗂 Key output fields
| Field | Meaning |
|---|---|
dataType | interestOverTime | interestByRegion | relatedQueries | relatedTopics | trendingNow |
timeline[].values | Relative search interest 0–100 (100 = peak within the window/compare set) |
timeline[].isPartial | The last point is usually partial — the current period is not finished yet |
measurablePeriods / totalPeriods | How many periods carried interest, out of how many Google returned; a sparse term reads e.g. 4 / 53 |
regions[].geoCode | ISO region code (US-WY), with the same 0–100 scaling |
top / rising | Related queries: top = most popular, rising = fastest-growing (value is % growth, formattedValue may be "Breakout") |
searchVolume / formattedSearchVolume | Trending Now: absolute volume bucket (e.g. 1000000 / "1M+") |
percentGrowth | Trending Now: growth vs the previous period, in % |
keywords | Compare mode: the full compare set; per-point values align with this array |
ERRORS.items[].reason | Why a result was not delivered — see the table above; retryable says whether re-running as-is can help |
⏰ Run it on a schedule
Save the input as a Task, put the Task on an Apify Schedule, and add an integration on run succeeded (a Google Sheet with one row per keyword per run is the usual shape). Google refreshes a 12-month timeline about weekly and the now windows about daily, so match the cadence to the window: weekly for today 12-m and longer, daily for today 1-m and now 7-d, hourly only for now 1-H / now 4-H and Trending Now. Have the integration read the ERRORS record too — the retryable entries are the ones worth queuing for a second pass.
❓ FAQ
Are the interest values absolute search counts? No. Google Trends publishes relative interest, scaled 0–100 against the peak in your chosen window (or across the compare set in compare mode). Only Trending Now rows carry absolute volume buckets.
Does a failed or empty run cost anything?
No result charges. A run that delivers nothing bills only the $0.01 run start. Every result that was asked for and not delivered is in the ERRORS record, and charged is false on each one.
Why did my run end as FAILED?
Because nothing was delivered and the cause was a block, a rate limit, or a fault on our side, and a green run with an empty dataset would have hidden that. The status message names the cause; the ERRORS record names every result. Re-run in a few minutes, and keep several terms in one run rather than launching one run per term — the latter is what trips Google's quota.
My term came back with no_data. Is the actor broken?
No: Google charts nothing for a term below its volume floor, and it says so with a complete, empty answer. Try a broader time range, drop the region filter, or use the topic id (/m/...) instead of the free-text term — the same term often charts.
Why is relatedTopics off by default?
Google serves the related-topics feed only to sessions it classifies as regular users and hands anonymous sessions an empty list; related queries are unaffected. Switch it on if you want the actor to try. When the list comes back empty, no row is written, nothing is charged, and the miss is recorded as topics_gated.
Can I paste a trends.google.com URL?
Not as a URL. Copy its parts into the fields instead: q goes to searchTerms (with compareKeywords on for a comma-separated compare), geo to geos, date to timeRange or customTimeRange, cat to category, gprop to property. Every output row carries an exploreUrl that opens the same query on the site.
Does it return interest by city? The region row holds the same breakdown the region map on trends.google.com shows for the location you query; Google picks its resolution (countries for worldwide, subregions or cities for a country). There is no switch to force a different resolution.
Can I compare more than 5 terms?
Google's compare view caps at 5 terms per request. With compareKeywords on, the actor splits longer lists into groups of 5 (each group is internally consistent). For cross-group comparability, include a shared anchor term in each group.
How fresh is Trending Now? It is the same live feed the trends.google.com "Trending now" page shows, queryable for windows of 4, 24, 48, or 168 hours per country.
Do I need my own proxies?
No. The actor ships with built-in residential routing. The proxy input exists only as an explicit override.
What happens when Google rate-limits?
A rate-limited widget call is retried once after a short wait; paying users also get a second network for those calls, capped per run. If Google keeps answering 429, the run stops retrying (a fresh IP is not fresh quota) and reports the affected results as rate_limited — not charged, marked retryable. Everything that succeeded is kept.
My own Trends script gets HTTP 429 on the first call. Why doesn't this actor?
Two different 429s come back from Trends, and most scripts treat them the same way. The first one, on a fresh session's first explore call, is a handshake: the response sets an NID cookie, and the same request sent again with that cookie returns 200. Scripts that read it as a block back off, retry without the cookie, and get 429 forever. The actor keeps the cookie on the session and repeats the handshake whenever Google asks for it again. The second 429 is a real per-IP quota on the widgetdata calls, and datacenter IPs (most cloud servers and CI runners) hit it almost every time. That is why a script that works on a laptop often fails once deployed. The actor routes through residential IPs, retries within limits, and reports what is still rate-limited as rate_limited without charging for it.
💬 Support
- Found a bug or need a field added? Open an issue on the actor's Issues tab in the Apify Console — issues are answered within a day.
- Custom requirements (bigger volumes, extra endpoints, private deployment)? Message via the Apify contact form.
🛠 Additional services
- Scheduling & monitoring — run the actor on a cron schedule from the Apify Console and export new rows to a webhook, database, or Google Sheets.
- Custom scrapers — need another data source scraped to the same standard? Get in touch via the profile below.
🔎 Explore more scrapers
- Keyword Metrics — the absolute numbers Trends can't give you: Google + Bing search volume, CPC, competition, top-of-page bids, difficulty, search intent, and ~93 months of history. 1000 keywords per run at one flat price, or expand 20 seeds into up to 20,000 keyword ideas across 111 countries and 46 languages.
- Google Autocomplete & Keyword Suggest Scraper — every suggestion Google completes for a seed, by country and language.
- Ahrefs Scraper — Domain Rating, backlinks, keyword ideas, and AI visibility for any domain.
- Semrush Scraper — traffic estimates, authority score, backlinks, and top websites per niche.
- Ubersuggest Scraper — keyword volume, CPC, difficulty, and domain backlink data.
If this Google Trends Scraper was useful, see other scrapers and actors at memo23's Apify profile — covering job boards, real estate, e-commerce, social media, and more.
🤖 For AI Agents & LLM Apps
Purpose: Google Trends relative search interest (0–100) for terms and locations, plus the live Trending Now board with absolute volume buckets.
Minimal tested input (one term, timeline only, fixed window):
What's trending right now: { "trendingNow": true, "trendingNowGeo": "US", "trendingNowHours": "24", "maxItems": 25 } (rows come back rank-ordered).
Output fields (flat): dataType, keyword, keywords, geo, timeRange, category, property, exploreUrl, timeline[].time, timeline[].formattedTime, timeline[].values, timeline[].isPartial, averages, measurablePeriods, totalPeriods, regions[].geoCode, top[], rising[], rank, query, searchVolume, formattedSearchVolume, percentGrowth, startTimestamp, relatedQueries.
Billing and behavior: $0.01 per run start plus $0.00075 per dataset row. One row per term × location × data type, so switch off the datasets you do not need. maxItems caps rows and cost. Results not delivered are in the key-value record ERRORS (items[].reason, items[].retryable) and are not charged. A run that delivers nothing because of a block ends FAILED with the cause in its status message; one where Google simply has no data ends SUCCEEDED.
⚠️ Disclaimer
This actor is an independent tool and is not affiliated with, endorsed by, or sponsored by Google. It retrieves only publicly available data that Google Trends serves to any visitor without signing in. "Google", "Google Trends", and related marks are trademarks of Google LLC. You are responsible for how you use the data, including compliance with applicable laws and Google's terms of service. Interest values are Google's own relative, sampled estimates and may change between requests.
SEO Keywords
google trends scraper, google trends api, scrape google trends, google trends data export, interest over time api, google trends csv download, trending searches scraper, google trends keyword research, related queries scraper, rising queries google trends, google trending now api, search interest data, google trends alternative api, trends.google.com scraper, google search trends data, keyword trend analysis tool, google trends json, google trends no api key, google trends custom date range, google trends historical data, google trends without browser


![Collecting Cars [$3💰] | 33k SOLD prices + live bids avatar](https://images.apifyusercontent.com/Hbn_LDWbVTHAyPL8k_edq8GAZOEin7g5i4_bFf2WimM/rs:fill:76:76/cb:1/aHR0cHM6Ly9hcGlmeS1pbWFnZS11cGxvYWRzLXByb2QuczMudXMtZWFzdC0xLmFtYXpvbmF3cy5jb20vbmduOHZSRVNUa3NleVdFNnAtYWN0b3ItRm1EYVRESkEyWGNYU0s4N24tVkJhU3V5RENuYi1Db2xsZWN0aW5nX0NhcnMud2VicA.webp)


![ForRentUniversity.com [$1.25💰] Scraper · Emails avatar](https://images.apifyusercontent.com/knob38rf08RjbTFOtyPTLKbUpJqNv69gLvD9GZvNHdY/rs:fill:76:76/cb:1/aHR0cHM6Ly9hcGlmeS1pbWFnZS11cGxvYWRzLXByb2QuczMudXMtZWFzdC0xLmFtYXpvbmF3cy5jb20vbmduOHZSRVNUa3NleVdFNnAtYWN0b3Itb2ZkQkJZZ0QzMndpZHZSemotT25mdk55NHJTQS1mcnUuanBlZw.webp)

