

Dark Pool Volume Tracker: Weekly ATS Trading by Ticker
Pricing
from $4.00 / 1,000 results
Dark Pool Volume Tracker: Weekly ATS Trading by Ticker
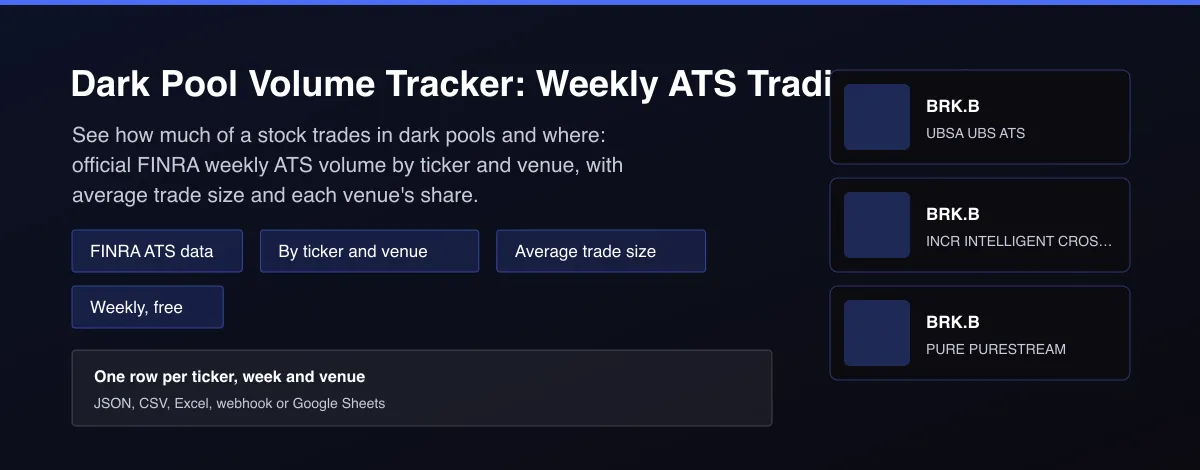
Weekly dark pool (ATS) volume by ticker and venue from FINRA: shares, dollar value, trade count, average trade size and each venue's share. Official public data, weeks delayed. No key.

What does Dark Pool Volume Tracker: Weekly ATS Trading by Ticker do?
Dark Pool Volume Tracker returns the weekly off-exchange volume that alternative trading systems (dark pools) report to FINRA, one row per ticker, week and venue. Each row has the number of shares, the total dollar value, the trade count, the volume-weighted price, the average trade size, the venue's share of that ticker's dark pool volume for the week, and the date FINRA published it. This is official public data published weeks after the trading week, aggregated per venue and week; individual trade prints are not part of it.
Why use Dark Pool Volume Tracker: Weekly ATS Trading by Ticker?
- Official FINRA data, the public record of dark pool volume, with no key.
- Per venue: see which dark pools trade a ticker and how large their share is.
- Average trade size and a large-trade flag help separate block activity from retail flow.
- Watchlists of many tickers in one run; delta mode delivers each new week once.
- Every row states when FINRA published it, so freshness is never hidden.
What makes this different
Paid dashboards sell dark pool prints in real time. This Actor is the free, official, delayed layer: weekly volume by ticker and venue straight from FINRA, with derived average trade size and venue share, and no pretence of being real time.
Who can use the Dark Pool Volume Tracker and how?
- Traders: see where a stock's dark pool volume trades and how big the average trade is.
- Quant teams: build off-exchange volume features by ticker and week.
- Market structure researchers: study venue market share and routing changes.
- Newsletter writers: publish the biggest dark pool tickers each week.
- Institutional desks: benchmark venue share for a name.
- Journalists: source dark pool volume with a citable official reference.
- Fintech developers: add an off-exchange volume view through the API.
- Analysts: pair with short interest and insider data.
How it works
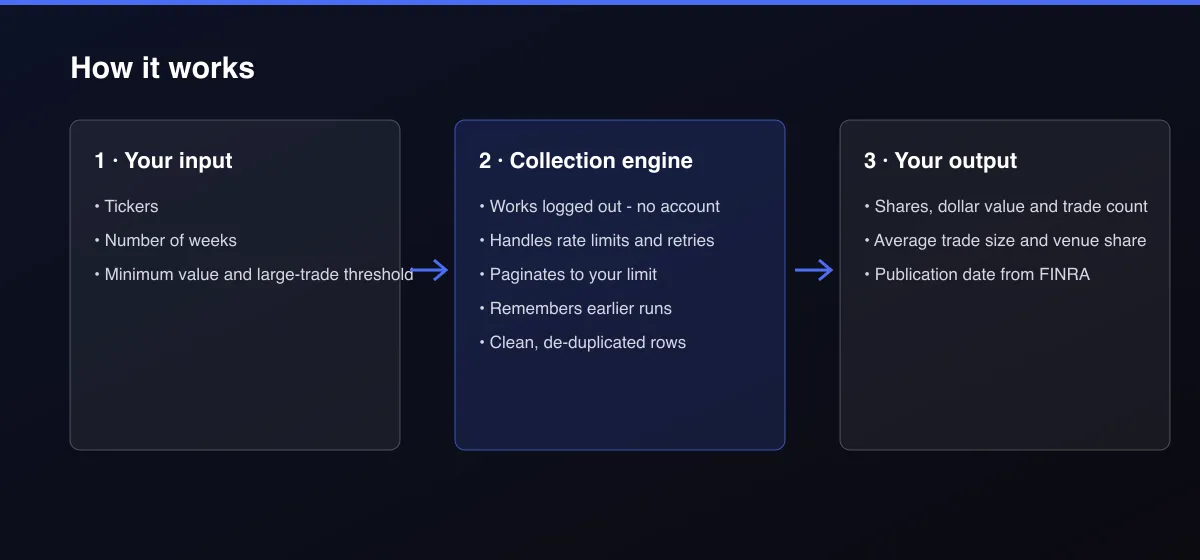
- Your input — enter tickers and how many recent weeks you want.
- The Actor collects it — the Actor reads FINRA's public ATS transparency data for each ticker.
- Your output — you get one row per ticker, week and venue with shares, value, trades, average size and share.
What data can you extract?
The dataset has 24 fields per row:
| Field | Type | Description |
|---|---|---|
ticker | string | Stock ticker. |
issue_name | string | Issue name from FINRA. |
week_start_date | string | Start of the trading week (YYYY-MM-DD). |
venue_name | string | Alternative trading system name. |
venue_mpid | string | Venue market participant id. |
venue_type | string | Always ats_dark_pool. |
tier | string | FINRA tier description. |
trade_size_shares | number | Shares traded at the venue that week. |
trade_value_usd | number | Dollar value traded at the venue that week. |
trade_count | number | Number of trades that week. |
price | number | Value divided by shares. |
average_trade_size_shares | number | Shares divided by trades. |
average_trade_value_usd | number | Value divided by trades. |
large_average_trade | boolean | True when the average trade reaches the large-trade threshold. |
share_of_ats_volume_pct | number | Venue share of the ticker's dark pool shares that week. |
ats_total_shares_week | number | All dark pool shares of the ticker that week. |
ats_total_value_usd_week | number | All dark pool value of the ticker that week. |
ats_venue_count_week | number | Number of reporting venues that week. |
reported_at | string | Date FINRA published the week. |
last_reported_trade_date | string | Last trade date included in the week. |
fetch_path | string | finra_public_api. |
source | string | Data source. |
scraped_at | string | Collection time (ISO 8601). |
actor_version | string | Output schema version. |
How to use Dark Pool Volume Tracker: Weekly ATS Trading by Ticker
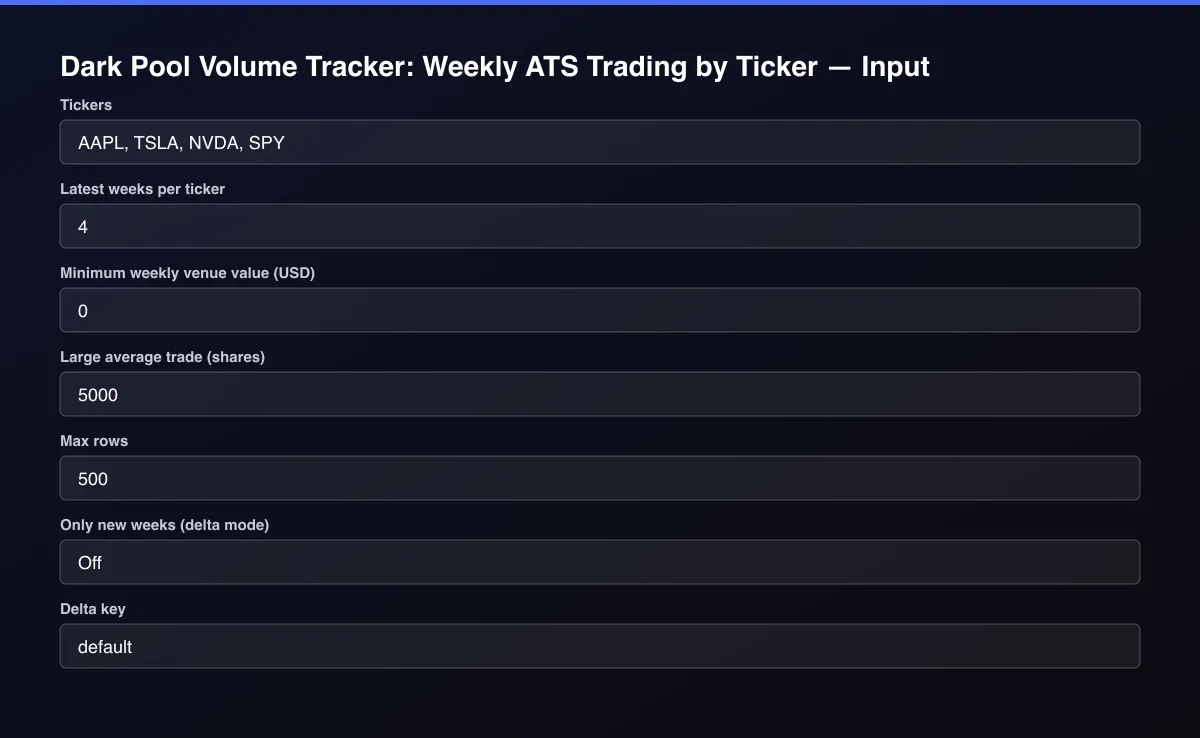
- Open the Actor and go to the Input tab.
- Enter Tickers, choose Latest weeks per ticker, and run. Filter by Minimum weekly venue value to focus on the large venues.
- Optionally set filters and a Max results limit.
- Click Start. A default run finishes in under a minute.
- Open the Output tab, then download the dataset or connect it to your tools.
Input Parameters
| Parameter | Type | Required | Default | Description |
|---|---|---|---|---|
tickers | array | No | [] | Stock tickers to read, one per line. |
weeks | integer | No | 4 | How many of the newest published weeks to return for each ticker. |
sinceDate | string | No | — | Only weeks after this date (YYYY-MM-DD). Default is the last 120 days, which covers FINRA's publication delay. |
minTradeSizeUsd | number | No | 0 | Skip venue rows whose total traded value for the week is below this. |
largeAverageTradeShares | number | No | 5000 | Rows whose average trade size reaches this many shares are flagged large_average_trade. |
maxItems | integer | No | 500 | Maximum number of rows returned. Set 0 for no limit. |
deltaMode | boolean | No | false | Return and bill only ticker-week-venue rows not delivered by an earlier run with the same delta key. FINRA publishes weekly. |
deltaStateKey | string | No | "default" | Name of the tracked stream. |
proxyConfiguration | object | No | {"useApifyProxy":false} | Optional proxy. FINRA's public data service works without one. |
Output Data
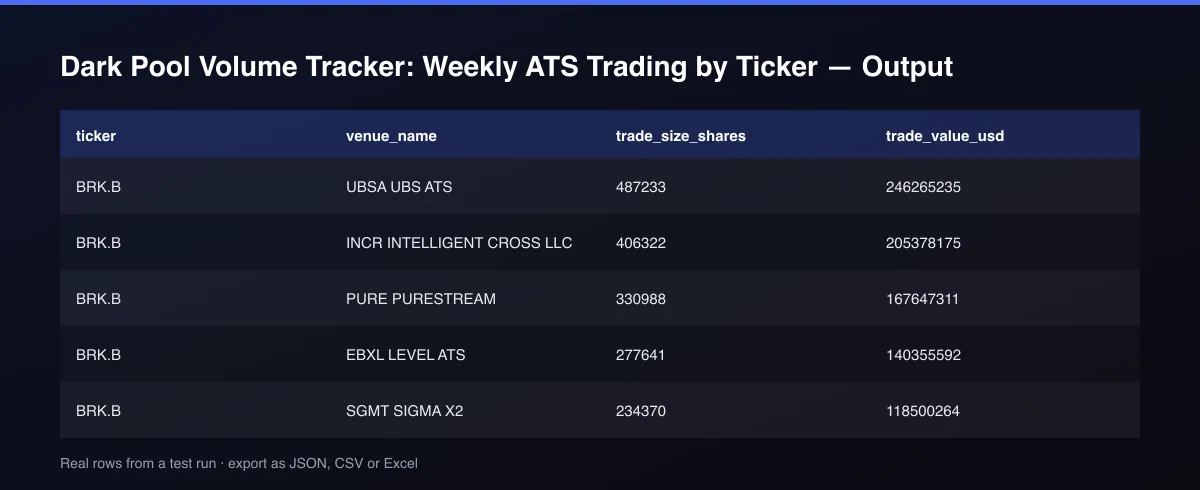
trade_size_shares, trade_value_usd and trade_count are the venue's totals for the week. price is value divided by shares. average_trade_size_shares is shares divided by trades; large_average_trade is true above your threshold (5,000 shares by default). share_of_ats_volume_pct is the venue's part of the ticker's total dark pool volume that week. reported_at is the date FINRA published the week.
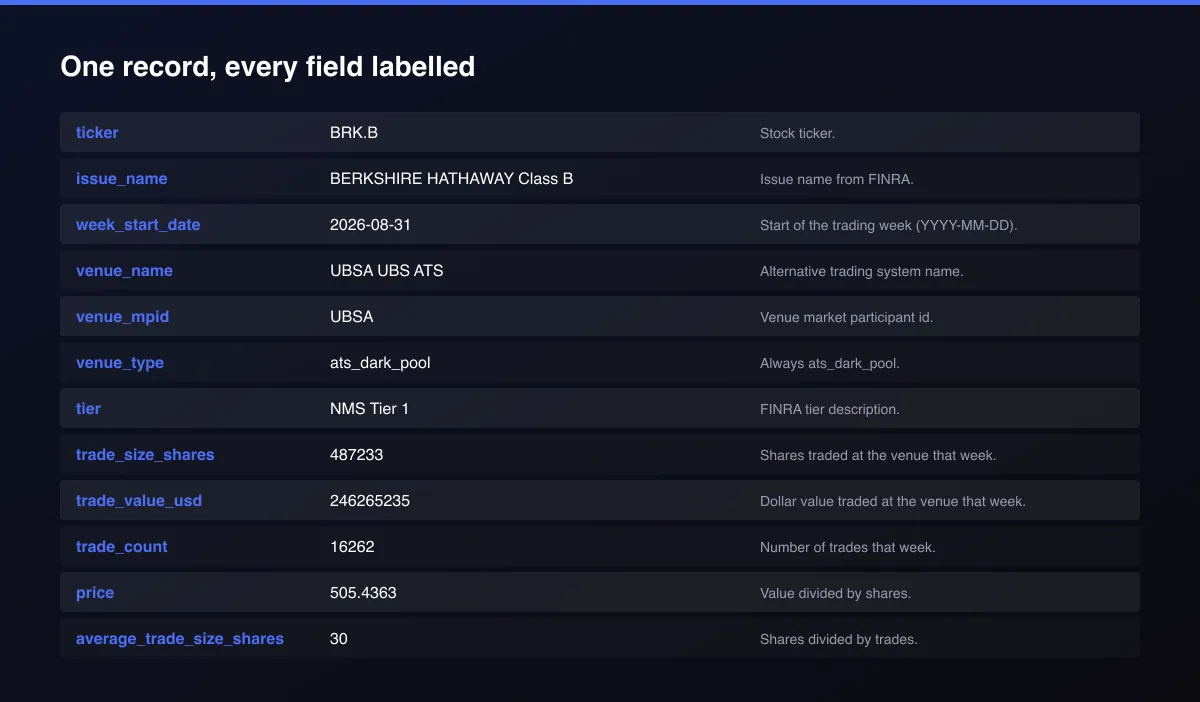
A real dataset item:
How to read and use the results
- Sort by trade_value_usd for the biggest venues.
- Read share_of_ats_volume_pct for venue concentration.
- Check average_trade_size_shares and large_average_trade for block-like activity.
- Compare weeks to see changes in dark pool activity.
- Read reported_at to know how fresh each row is.
- Automate with delta mode and a weekly schedule.
Usage Examples
Dark pool volume for a watchlist
Only large venues for one ticker
Only new weeks since last run
Tips for Best Results
- Compare a venue's average trade size with the ticker's typical size to spot block-heavy venues.
- Track share_of_ats_volume_pct over weeks to see routing shifts.
- Schedule weekly with delta mode; FINRA publishes each week a few weeks late.
- Combine with insider buying and short interest for a fuller institutional-flow picture.
- Default is 5 results for a fast test. Set the max to 0 to return everything available.
Reliability by mode
| Mode | Status | Needs login or key? | Notes |
|---|---|---|---|
| Weekly volume per venue | ✅ | No | FINRA public data. |
| Average trade size and venue share | ✅ | No | Derived from the same rows. |
| Individual dark pool prints | ❌ | - | Not public; sold by vendors. |
| Real-time data | ❌ | - | Published weeks late. |
| Buy or sell direction | ❌ | - | Not in the data. |
| Tickers with no ATS volume | 🟡 | No | Return a clear warning. |
✅ works as described, 🟡 works with caveats, ❌ not supported.
Only new records (delta mode)
Turn on Only new weeks (delta mode) and set a Delta key. Each scheduled run returns, and bills, only ticker-week-venue rows that earlier runs of that key have not delivered.
Known Limitations
- This is weekly aggregate volume per venue, not individual dark pool trade prints. Trade-level prints are sold by market data vendors and are not part of FINRA's public data.
- Data is published weeks after the trading week (see reported_at); it is not real time.
- Only alternative trading systems (dark pools) that report to FINRA are included, not internalized retail flow.
- Volume figures show activity, not direction: FINRA data does not say whether trades were buys or sells.
- Newly listed or thinly traded tickers can have no rows.
- FINRA's data terms apply; check them for your commercial use. This is information, not investment advice.
Integrations
Run it from the Apify API, on a schedule, or from a webhook. Send results straight to Google Sheets, Make, Zapier, Slack or your own database with Apify's built-in integrations.
Export Formats
Download the dataset as JSON, CSV, Excel, XML, HTML table or RSS from the Output tab or the API.
Frequently Asked Questions
Where does the data come from?
FINRA's public OTC transparency data for alternative trading systems, served by FINRA's own data API. It is an official public source.
Does it show individual dark pool prints?
No. FINRA's public dataset is weekly totals per venue and ticker. Individual prints are only available from paid market data vendors.
Why is the data weeks old?
FINRA publishes ATS transparency data with a delay of a few weeks. reported_at shows the publication date.
Does it need an API key?
No.
What is a large_average_trade?
A venue whose average trade for the week is at least the number of shares you set, 5,000 by default, which points to block-size activity.
Am I charged for failed results?
No. You are only charged for rows written to the dataset.
Do I need an account or login?
No. The Actor reads FINRA's public data service and needs no account or API key.
Am I charged for failed runs or empty results?
You are only charged for results that are actually written to the dataset.
Can I run it on a schedule?
Yes. Create a Task with your input and add a schedule in Apify Console. With monitor mode on, each scheduled run returns only what changed since the previous one.
Changelog
- 2026-09-26: First release: weekly FINRA ATS volume by ticker and venue with average trade size, venue share and delta mode.
Enterprise and custom work
Need higher volumes, a custom output schema, dedicated scheduling or a no-breaking-changes commitment for a production pipeline? Open an issue on the Actor page and describe your use case. Bulk terms and custom builds are available.
Support
Questions or a missing field? Open an issue from the Issues tab on this Actor's page and it will be looked at.
Legal / Responsible Use
This Actor reads data that FINRA publishes for the public. FINRA's data usage terms apply to your use. You are responsible for how you use the data. It is not investment advice and not affiliated with FINRA.


