

Europe House Prices — Eurostat House Price Index (Quarterly)
Pricing
from $33.50 / 1,000 house price index records
Europe House Prices — Eurostat House Price Index (Quarterly)
Europe house prices as data: the official Eurostat house price index, quarterly, one row per observation — country, quarter, dwelling type (all, new, existing), unit and index value, verbatim from the source. No API key. Pay per record. Part of NexGen Signal — official-source data products
Pricing
from $33.50 / 1,000 house price index records
Rating
0.0
(0)
Developer
NexGen Signal
Maintained by CommunityActor stats
0
Bookmarked
2
Total users
1
Monthly active users
17 days ago
Last modified
Categories
Share
Europe house prices, straight from the official Eurostat house price index. Quarterly index values by country and dwelling type — all, new and existing dwellings — as clean records, one per observation.
Official source. No API key. Pay per record.
This actor turns Eurostat's quarterly House Price Index (dataset prc_hpi_q) into clean, per-record data. Each run reads the index directly from Eurostat's public JSON-stat dissemination API, unpacks every observation into a single flat row, and delivers one record per data point — the geography, the period, the type of dwelling purchase, the unit, the index value, and Eurostat's own status flag, all reproduced exactly as Eurostat publishes them. You are billed only for records you actually receive. A blocked or failed run delivers nothing and charges nothing.
What this is, in one paragraph
The House Price Index measures how the prices paid by households to buy residential dwellings change over time, expressed as an index (2015 = 100 for the standard index unit). This actor does not model, forecast, rescale, or reinterpret anything. It fetches the published figures, applies the licence-permitted geography filter (explained below), and hands you the numbers as rows you can load into a spreadsheet, a database, or a pipeline. If Eurostat says the value for Germany in 2024-Q1 is 148.99, that is exactly what lands in your dataset — same value, same unit, same flag.
Who buys this and for what job
This is built for people who need the official European house-price series as data, not as a chart on a web page:
- Analysts and researchers comparing residential price trends across EU and EFTA markets without hand-copying figures out of Eurostat's browser.
- Proptech, mortgage, and real-estate teams that want the benchmark index feeding a model or dashboard on a repeatable schedule.
- Data engineers who want a keyless, one-call source of a well-known official series they can wire into an existing pipeline in minutes.
- Journalists and policy teams who need the underlying numbers behind a headline, with the exact period, unit, and provisional/break flags intact.
The job it does: get the official index, every geography and quarter, as rows — reliably, with provenance, and without an account or key at the source.
Buyers usually search for this as "Europe house prices" or "house price index".
Sample output
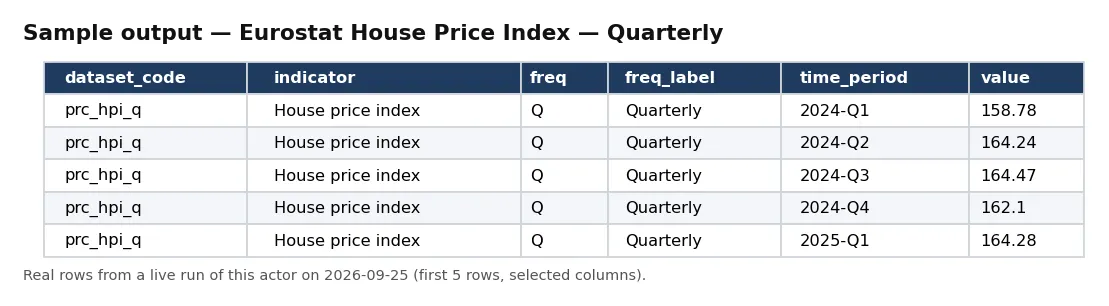
Real rows from a live run of this actor (first 5 rows, selected columns).
One full record from the same run, exactly as delivered:
Pricing
Pay per event. One event: a delivered house price index record. Tiered by your Apify plan; the record is delivered before it is charged.
| Event | What triggers it | Free plan | Bronze | Silver | Gold / Platinum / Diamond |
|---|---|---|---|---|---|
house_price_record | One delivered index observation | $0.05 | $0.045 | $0.04 | $0.0335 |
There is no start fee and no subscription. Blocked runs, source outages, and empty results cost nothing, because the charge only fires after a record is pushed to your dataset.
Input
| Field | Type | Default | Description |
|---|---|---|---|
sinceTimePeriod | string | 2024 | Earliest period to return. A year (2024) or a quarter (2024-Q1). An earlier start returns more history and more records. |
maxRecords | integer | 10 | Ceiling on records delivered and billed this run. The default is a small, fast sample; raise it (up to 200,000) to pull the full set. |
Default changed on 30 Sep 2026: if you leave maxRecords out, a run now returns up to 10 records (it was 500). Set maxRecords yourself to get more — the maximum is unchanged.
Both fields are optional. The default run — sinceTimePeriod = 2024, maxRecords = 10 — is a bounded sample that finishes in well under a minute so you can see the shape before you scale up.
Output
One JSON object per observation. Values, units, dimension codes, and status flags are copied verbatim from Eurostat; a composite record_id (freq:purchase:unit:geo:time) uniquely identifies each row so no two source observations ever collapse together. Example record from a real run:
The purchase dimension distinguishes total dwellings from new versus existing dwellings, verbatim from Eurostat. The unit dimension distinguishes the index (2015 = 100), the quarterly and annual rates of change, and so on — again, verbatim. Where Eurostat attaches a status flag (for example p for provisional or b for a series break), it appears in obs_status unchanged.
Every run also writes an unbilled RUN_RECEIPT to the run's key-value store: the robots check result, the source URL, how many observations were present, how many were delivered, how many were excluded as missing or as commercial-barred geographies, and whether the number charged equals the number delivered.
Cost guidance
A typical run bills one house_price_record per delivered observation, so the cost is simply the number of records you pull times your plan's per-record price. Pulling the full quarterly set from 2024 onward is roughly 3,700 records — about $185 on the Free-plan rate, or about $124 at the Gold-tier rate. The ten-record Store example is about $0.50 (Free) or $0.34 (Gold). You control the volume with sinceTimePeriod and maxRecords.
Honest limitations and caveats
- It is an index, not a price. The values are index numbers (2015 = 100 for the index unit) or rates of change — not house prices in euros, not valuations, and not an affordability measure. Do not read a value of 158.9 as a price.
- Cadence. The source is quarterly. Recent quarters are frequently marked provisional and are revised in later releases; because this is a living source, a value you pull today can change in a future Eurostat update. Pull again to refresh.
- Coverage is licence-limited by design. Eurostat permits commercial reuse only for EU, EFTA, and official EU acceding/candidate countries. Geographies outside that set (for example the United Kingdom, and non-European reporters) are excluded at ingest and counted in the run receipt. This is a deliberate compliance choice, not a data gap.
- Missing observations are excluded, never invented. Where Eurostat has no observation for a cell, no row is produced; the count of missing cells is reported in the receipt. Published zeros are kept as real values.
- No person-level data. This series is national/aggregate only. There is no individual, household, or address data in the source and none is ever constructed.
- Partition. One run pulls the whole permitted set for the chosen start period in a single call; there is no per-country partitioning needed at this size.
The NexGen Signal family
Part of the NexGen Signal family of official-source, per-record Eurostat products. Its live siblings on the store — all official source, no API key, values verbatim, pay per record:
- Eurostat Waste Generation
- Eurostat Waste Treatment
- Eurostat Business & Consumer Confidence
- Eurostat Income Distribution (EU-SILC)
Source: Eurostat. Reformatted from the Eurostat JSON-stat dissemination API; values unmodified. Third-party content and logos are excluded. Data for geographies outside EU/EFTA/candidate countries is excluded in line with Eurostat's reuse terms.


