

Industrial Production & Capacity Utilization API — Fed G.17
Pricing
from $33.50 / 1,000 g.17 industrial production observations
Industrial Production & Capacity Utilization API — Fed G.17
Federal Reserve G.17 as data: industrial production indexes, capacity and capacity utilization by industry and market group, motor vehicle assemblies and power use, monthly from 1919. Filter by dataset, industry and date. No API key. Part of NexGen Signal — official-source data products
Pricing
from $33.50 / 1,000 g.17 industrial production observations
Rating
0.0
(0)
Developer
NexGen Signal
Maintained by CommunityActor stats
0
Bookmarked
2
Total users
1
Monthly active users
8 days ago
Last modified
Categories
Share
🏭 Industrial Production & Capacity Utilization API — Fed G.17
Get the Federal Reserve's G.17 Industrial Production and Capacity Utilization as clean records — industrial production indexes by industry and market group, capacity and capacity utilization rates, gross value of products, relative importance weights, motor vehicle assemblies, electric power use and diffusion indexes, monthly back to 1919 — from the Board's official release package.
Economists, manufacturers, investors and analysts use G.17 to follow factory, mining and utility output and how hard capacity is being used. This actor reads the Board's file and delivers one record per value with the dataset and industry spelled out — no XML, no API key.
The unit of output is one observation (one series in one dataset, one date). You pay per observation delivered; a run that finds nothing costs nothing.
📊 Sample Output
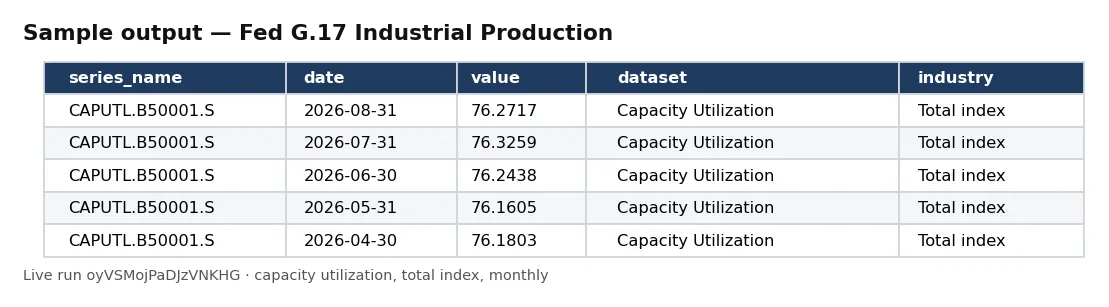
| series_name | date | value | dataset | industry |
|---|---|---|---|---|
| CAPUTL.B50001.S | 2026-08-31 | 76.2717 | Capacity Utilization | Total index |
| CAPUTL.B50001.S | 2026-07-31 | 76.3259 | Capacity Utilization | Total index |
| CAPUTL.B50001.S | 2026-06-30 | 76.2438 | Capacity Utilization | Total index |
| CAPUTL.B50001.S | 2026-05-31 | 76.1605 | Capacity Utilization | Total index |
| CAPUTL.B50001.S | 2026-04-30 | 76.1803 | Capacity Utilization | Total index |
Rows from live run oyVSMojPaDJzVNKHG on Apify (input: dataset CAPUTL, industries B50001 and GMF, seasonally adjusted, monthly, since 2025). Notice the newest month first and the dataset and industry named on every row (utilization in percent).
✅ What you get
Every field of each record:
record_id— unique per observation: release, series code and date (plus the dataset, because the Board repeats some series in several datasets).release_code—G.17.series_name— the Board's series code, e.g.CAPUTL.B50001.S.series_description,series_long_description— the Board's short and long descriptions.dataset_code,dataset— the G.17 dataset, e.g.CAPUTL= Capacity Utilization.industry_code,industry— industry or market group, e.g.B50001= Total index,GMF= Manufacturing (NAICS).seasonal_adjustment_code,seasonal_adjustment—SAorNSA.frequency—Monthly,QuarterlyorAnnual(from the Board's code list).unit,unit_multiplier,currency— unit and multiplier from the Board's code lists (e.g.Currency,Millions), and the currency where one applies.date— period end date as published (e.g.2026-06-30for the second quarter).value— the observation as a number.observation_status,observation_status_label—Anormal;NC/NDnot calculable / no data (delivered only withincludeNoData).release,release_prepared— release name and when the Board prepared the package.source,source_dataset,licence,attribution,observed_at— provenance on every record: the Board and the release, the package file and its last-modified time, the Board's public-domain notice quoted, the citation the Board asks for, and the UTC read time.
⚙️ Sample inputs
1. Store example — industrial production and capacity utilization, total index
The 10 newest months of the total industrial production index (the first matching series); about $0.50 on the Free plan.
2. Narrowed — capacity utilization by industry since 2024
Every seasonally adjusted monthly utilization rate from January 2024.
3. Bulk — latest month of every durable-goods production series
One record per monthly durable-goods series: its newest month.
Input fields:
| Field | Meaning |
|---|---|
seriesNames | exact Board series codes, e.g. IP.B50001.S |
seriesNameStartsWith | series codes starting with any of these, e.g. CAPUTL. |
descriptionContains | every word of an entry in the description; quote a phrase to keep it together |
datasets | G.17 dataset ids, e.g. IP_MAJOR_INDUSTRY_GROUPS, CAPUTL, CAP, RIW, MVA, KW |
industryCodes | industry codes, e.g. B50001, GMF, G3361T3 |
seasonalAdjustment | SA, NSA |
frequencies | monthly, quarterly, annual |
dateFrom / dateTo | date window |
latestOnly | one record per series |
includeNoData | also deliver not-calculable values |
order | newest_first or oldest_first |
maxRecords | most observations delivered and billed (default 1,000) |
🧾 JSON sample record
🔧 How it works
-
Robots check.
www.federalreserve.gov/robots.txtis requested on every run. It answers with an HTML "page not found" (HTTP 404): no robots policy is published (FLAGGED). The actor records that and relies on the Board's public-domain notice; a real robots.txt that disallowed the package would stop the run with nothing charged. -
Table of contents first. The release package
FRB_g17_xml.zipis a static ZIP on the Board's G.17 release page. The actor reads its table of contents and code lists by byte range, then streams and decompresses the data file as it arrives. -
Filter while reading. Each series is checked against your filters as soon as it starts; only matching series keep their observations.
-
Deliver, then charge. Matching observations (newest first by default) are pushed in batches, each charged after delivery, so records and charges always match. Reading stops at
maxRecordsor your maximum charge. -
Receipt.
RUN_RECEIPTrecords the robots result, the package and its date, bytes read, series matched, and delivered and charged counts.
No login, API key, proxy or bot workaround — one public Board file, and no personal data in it.
💰 Pricing example
Per observation delivered, no start fee, no monthly charge:
| Apify plan | Price per observation |
|---|---|
| Free | $0.05 |
| Bronze | $0.045 |
| Silver | $0.04 |
| Gold, Platinum, Diamond | $0.0335 |
- 10 observations (the Store example): $0.50 on the Free plan, $0.335 on Gold.
- 1,000 observations (the default cap): $50 on Free, $45 on Bronze, $40 on Silver, $33.50 on Gold.
Coverage and size. Live count from the package read on 3–4 October 2026 (FRB_g17_xml.zip, 8.6 MB compressed, Last-Modified 22 September 2026; package prepared 16 September 2026 for the 18 September release): 1,075,417 observations in 2,681 series across 14 datasets, from 1919-01-31 to 2026-08-31; 1,075,410 carry a value and 7 are marked not calculable. The planning index counted 1,075,417 observations across 2,681 series in 14 datasets — they agree. The Board repeats some series in more than one dataset (the total index appears in three), so filter by datasets to avoid copies. A filter is required; a whole-file read takes seconds, and a full pull is 1,075,410 valued records, billed per observation.
⚖️ Legal & ToS
Data: Board of Governors of the Federal Reserve System, G.17 Industrial Production and Capacity Utilization, from the XML package on the Board's statistical release page. The Board's notice says: "Unless otherwise indicated, information on Board's website is in the public domain and may be copied and distributed without permission. Please cite to the Board as the source of the information." Every record carries that notice in licence and a citation in attribution.
Robots FLAG: www.federalreserve.gov/robots.txt returns a 404 page — no robots policy is published. That is recorded on every run and not treated as permission by itself; the public-domain notice governs reuse. One public file, declared User-Agent, no login, key, proxy or form. Aggregate statistics only — no personal data.
Data Download Program retirement: the Board is retiring its Data Download Program ("Build Your Package" goes the week of November 9, 2026; the program later). Its notice (16 July 2026) says historical data "will remain available for download as XML files on statistical release pages" — that release-page XML file is exactly what this actor reads, not the Data Download Program. If the Board ever moves or withdraws it, runs end with a source-unavailable message and nothing is charged.
Not affiliated with or endorsed by the Federal Reserve; figures are the Board's as published.
❓ FAQ
Do I need a FRED key or an account? No. The actor reads the Board's public release file, which needs no key, login or registration.
Why must I give a filter? The full release is 1,075,417 observations. A filter keeps runs fast and bills only what you asked for; an unfiltered run is refused with a clear message.
How fresh is the data? As fresh as the Board's G.17 package: every record carries the package's prepared time and last-modified date.
What happens when the Data Download Program retires? Nothing for this actor: it already reads the release-page XML file the Board says will remain available.
Why do I see the same series twice?
The Board publishes some series in several datasets (major industry groups, market groups, special aggregates). Each record names its dataset; add datasets to pick one.
🆘 Troubleshooting
- 0 records — dataset ids are written in capitals with underscores, e.g.
IP_MARKET_GROUPS. - Duplicate series — add
datasets. - Stopped at maxRecords — raise
maxRecordsor uselatestOnly. - SOURCE UNAVAILABLE message — the server did not answer after three tries; nothing was charged — run again later.
- CAPPED message — your maximum total charge was reached; raise it in the run options.
🔗 Related Actors
- Sweden Industry Turnover Monthly - SCB — monthly industry turnover in Sweden.
- Eurostat Construction Production — Monthly — European construction output.
- Eurostat Business & Consumer Confidence — Monthly — business and consumer confidence across Europe.
- UK Construction Output Monthly - ONS — UK construction output.
🏢 About NexGen Signal — official-source data products from government and regulator publications. Browse the catalog: apify.com/nexgensignal
⭐ Found this useful?
If this actor saved you time, a rating on its Apify Store page helps other buyers find it.
Part of NexGen Signal — official-source data products.


