Apify Store Market Analyzer
Pricing
from $1.00 / 1,000 results
Apify Store Market Analyzer
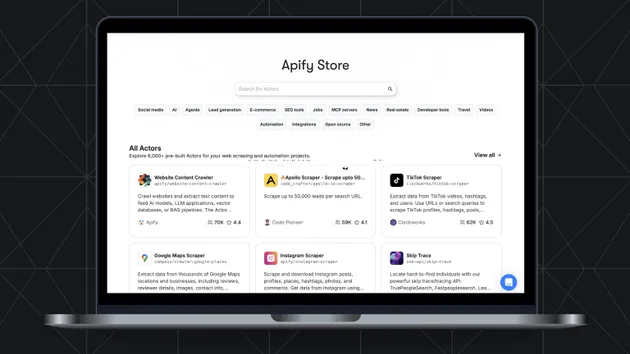
Analyze Apify Store Actors for competitive intelligence. Compare demand, pricing, ratings, categories, and growth to identify marketplace gaps and stronger Actor ideas.
Pricing
from $1.00 / 1,000 results
Rating
0.0
(0)
Developer

LIAICHI MUSTAPHA
Maintained by CommunityActor stats
4
Bookmarked
60
Total users
4
Monthly active users
3 months ago
Last modified
Categories
Share
Analyze public Apify Store Actor data for competitive intelligence, pricing research, category demand, ratings, growth signals, and marketplace gaps. The Actor collects comparable Store records and can generate an SEO opportunity report for deciding what to build next.
Features
- Collects public Actor metadata from the supported Apify Store API
- Uses stable 1,000-record pagination, retries, and Actor-ID deduplication
- Supports full-store, category, top-performer, eligibility, and idea-discovery modes
- Filters Actors by total users, total runs, pricing model, and opportunity score
- Extracts pricing, categories, ratings, bookmarks, usage, and developer information
- Generates a separate SEO opportunity report with recent-demand niches, title keywords, phrases, and growth signals
- Provides focused dataset views and a
STATSrun summary
Use Cases
- Actor opportunity research: identify demand with limited quality supply
- Competitive intelligence: compare products, adoption, pricing, and ratings
- Store SEO research: discover recurring terms used by successful Actors
- Pricing strategy: compare monetization models across relevant categories
- Portfolio planning: prioritize Actor ideas using structured marketplace evidence
Input
| Field | Type | Default | Description |
|---|---|---|---|
mode | string | findNewIdeas | Full Store, category, eligible, top Actors, or opportunity discovery |
categories | array | ["AI"] | One or more Apify Store categories |
maxActors | integer | 50 | Maximum unique Actors to collect; 0 uses the complete selected Store population |
minTotalRuns | integer | 0 | Minimum lifetime runs |
minTotalUsers | integer | 0 | Minimum lifetime users |
pricingModels | array | all | Optional pricing-model filter |
includeAnalytics | boolean | true | Generate the SEO opportunity report |
includeUnrunnableActors | boolean | true | Include all public Store Actors rather than only the runnable-safe subset |
minOpportunityScore | integer | 0 | Minimum score for returned opportunities |
Output
Each standard dataset row represents one public Actor record:
When analytics are enabled, SEO_REPORT contains a separate report:
How to Use
- Open the Actor and click Try for free.
- Choose an analysis mode and relevant categories.
- Keep
maxActors: 50for a quick test. - Enable analytics when you need opportunity scoring.
- Start the run and inspect the Actor records view.
- Open
SEO_REPORTfrom the Output tab for the derived market analysis.
Pricing
This is a pay-per-event Actor. A dataset record costs $0.001, or $1 per 1,000 results, plus any platform usage shown by Apify. The optional SEO report adds one dataset item and is also exposed directly through the key-value store.
FAQ
Where does the data come from?
The Actor queries the public search index used by the Apify Store. It does not access private account or billing data.
Why can Store totals change between runs?
Actors, pricing, usage, and publication status change continuously. Each run is a current snapshot.
What does the opportunity score mean?
It is a bounded comparative heuristic. Niche scores compare winsorized 30-day demand share with supply share. Keyword scores combine recent demand, relative Store demand, supply, and observation confidence. It is not a revenue guarantee.
How is growth calculated?
Growth compares the 7-day user run rate with the 30-day window, then compares 30-day users with the preceding 60-day monthly average. This measures recent momentum instead of dividing lifetime users by Actor age.
Can a full-Store run be expensive?
Yes. maxActors: 0 can produce tens of thousands of dataset rows. With pay-per-result pricing, use a smaller limit unless you specifically need a full-market export.
Can I track changes over time?
Yes. Schedule the Actor and preserve each dataset or export results into your own database.
Does eligibility mean an Actor is profitable?
No. Eligibility is a platform attribute; it does not prove demand, revenue, or profitability.
For Store-index changes or report issues, open the Issues tab on this Actor.