Google Maps Rank Tracker
Pricing
from $600.00 / 1,000 5x5 grid scans
Google Maps Rank Tracker
Track Google Maps rankings across a geo-grid heatmap. Get SoLV score, competitor leaderboard, gap analysis, zone breakdown, trend tracking & interactive HTML dashboard. Bulk scan up to 10 businesses. White-label reports. Free LocalFalcon & BrightLocal alternative — 50% cheaper, no monthly fees.
Pricing
from $600.00 / 1,000 5x5 grid scans
Rating
5.0
(1)
Developer
Vasram Sonagara
Maintained by CommunityActor stats
2
Bookmarked
7
Total users
4
Monthly active users
3 days ago
Last modified
Categories
Share
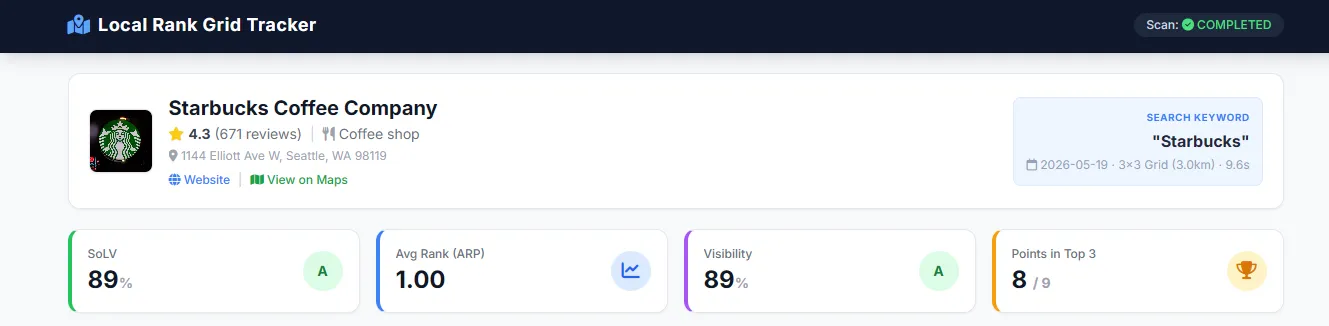
Track your Google Business Profile ranking across a geographic grid. Whether you need a Google Maps rank tracker API for programmatic tracking, or a local SEO rank heatmap automation tool without monthly fees, this actor is the perfect solution. It works just like LocalFalcon but at half the cost and fully automated on Apify. Enter your business name, keyword, and location. The actor scans Google Maps at every point on a customizable geo-grid to calculate professional Local SEO metrics: Share of Local Voice (SoLV), Average Rank Position (ARP), competitor leaderboards, gap analysis, zone-by-zone breakdown, trend tracking, and a beautiful interactive HTML heatmap dashboard — ready for client presentations.
No monthly subscription. No coding required. Pay only per scan, starting at $0.25. Results in JSON, CSV, Excel, or a self-contained HTML dashboard. Every Apify account gets $5 free credits/month — enough for ~8 scans at no cost.
🌐 See a live dashboard example → — Open a real scan result in your browser right now.
🎯 What can Google Maps Rank Tracker do?
This actor is a complete local SEO rank tracking tool built for agencies, small business owners, and SEO consultants. It replicates the functionality of expensive tools like LocalFalcon and BrightLocal's Local Search Grid — at a fraction of the cost.
Core capabilities:
- 📍 Geo-grid rank scanning — Scan a 3×3, 5×5, 7×7, or 9×9 grid around your business location
- 📊 Industry-standard metrics — SoLV (Share of Local Voice), ARP (Average Rank Position), ATRP (Average True Rank Position), Dominance Score, Visibility %
- 🏆 Competitor leaderboard — See who's outranking you, where they beat you, and their threat level (🔴 HIGH / 🟡 MEDIUM / 🟢 LOW)
- 📉 Gap analysis — Rating gap, review count gap, and category advantage vs. the market leader
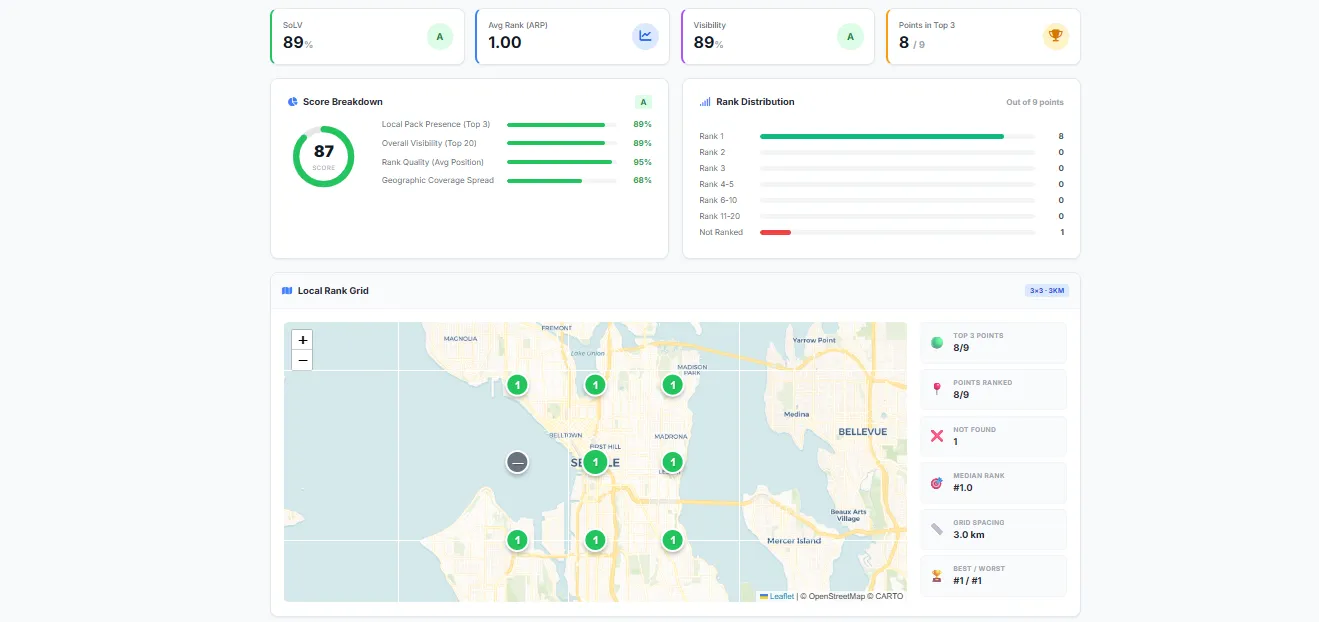
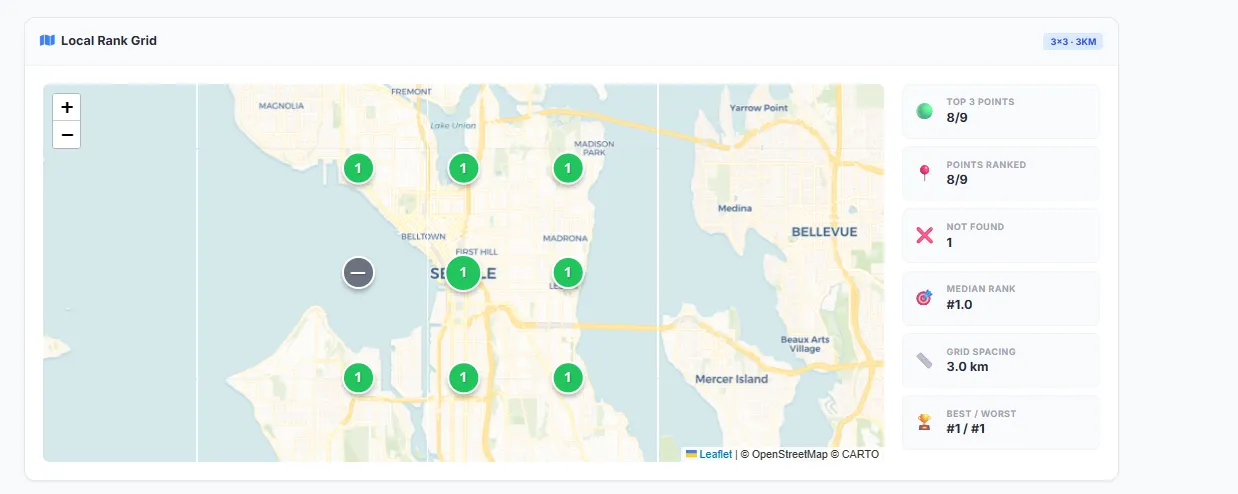
- 🗺️ Interactive HTML heatmap — A self-contained dashboard with Leaflet.js map, color-coded grid, and score cards
- 📈 Trend tracking over time — Compare scans to see rank changes, SoLV deltas, and new/lost competitors
- 🔍 Zone-by-zone analysis — North, South, East, West, Center — see exactly where you're strong, weak, or have opportunities
- 💡 Automated insights & alerts — CRITICAL / WARNING / OPPORTUNITY alerts with suggested actions and recommendations
- ⭐ Review breakdown — Star distribution (1★–5★) for your business without extra tools
- 🏷️ Category mismatch detection — Flags competitors ranking for your keyword who are in a different business category
- 🌍 10 language support — English, Hindi, Spanish, French, German, Portuguese, Arabic, Japanese, Korean, Chinese
- 🔗 Apify platform integrations — Schedule daily/weekly scans, use webhooks, connect with Zapier, Make, or your own API
- 📦 Bulk multi-location scanning — Scan up to 10 businesses in a single run — perfect for agencies managing multiple clients
- 🏷️ White-label reports — Add your agency name and logo to the HTML dashboard for professional client presentations
📊 What data can you extract from Google Maps rankings?
| Data Category | What You Get |
|---|---|
| Your Business Profile | Name, address, rating, reviews, categories, phone, website, opening hours, Place ID, Google Maps URL, business status |
| Review Breakdown | Star-by-star distribution (5★ to 1★ count), price level |
| Rank at Each Grid Point | Rank position (1–20+), Local Pack status (top 3), zone color (🟢🟡🔴⚫), direction (N/S/E/W/NE/NW/SE/SW/Center), distance from center, Google Maps search link |
| Core Metrics | SoLV, ARP, ATRP, Visibility %, Dominance Score (0–100), Letter Grade (A+ to F), rank distribution, median rank |
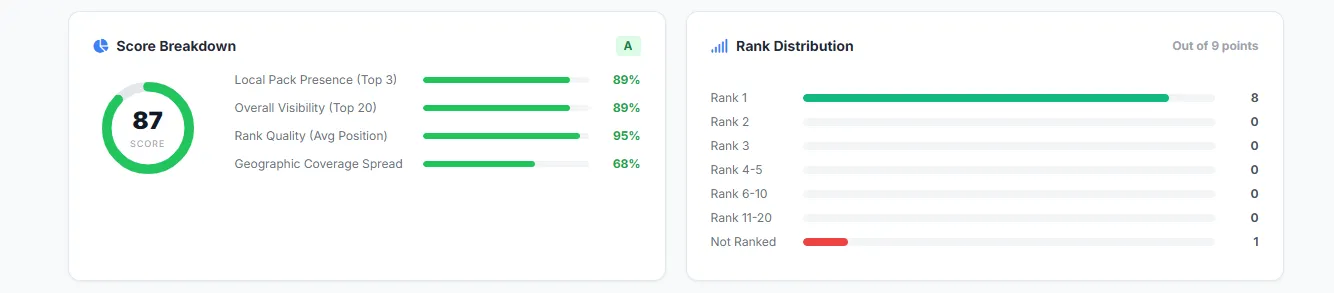
| Scoring Breakdown | Overall score with 4 weighted components: Local Pack Presence (35%), Overall Visibility (25%), Rank Quality (25%), Geographic Coverage (15%) |
| Competitor Leaderboard | Top competitors ranked by threat score — with their SoLV, ARP, rating, reviews, head-to-head comparison, and category mismatch flag |
| Gap Analysis | Rating gap to leader, review count gap, category advantage detection |
| Zone Analysis | N/S/E/W/Center performance with per-zone SoLV, grade, and status (DOMINANT / STRONG / WEAK / CRITICAL) + strongest, weakest, and opportunity zone |
| Trend Tracking | Rank changes vs. previous scan, SoLV delta, new/lost competitors (requires 2+ scans) |
| Automated Insights | Alerts (CRITICAL / WARNING / POSITIVE / OPPORTUNITY), actionable recommendations, and a plain-English summary |
| HTML Dashboard | Interactive map with color-coded grid markers, score card, competitor table, zone chart — downloadable as a single HTML file |
💡 Why track your Google Maps rankings?
Tracking your Google Maps rank from a single location gives you incomplete data. Your ranking changes depending on where the searcher is standing. A customer 2 miles north of your business might see you at #1, while someone 3 miles south sees you at #15 — or not at all.
Geo-grid rank tracking solves this by scanning your rank from dozens of locations across your service area.
Here's how businesses use this data:
- 🏢 Local SEO agencies — Generate professional client reports showing exactly where they rank (and where they don't)
- 🔧 Service businesses (plumbers, HVAC, lawyers, dentists) — Discover which neighborhoods you're invisible in
- 📈 Track SEO progress — Run weekly scans to measure whether your optimization efforts are actually working
- 🕵️ Competitive intelligence — See which competitors dominate your area and how you compare head-to-head
- 📋 Multi-location brands — Audit Google Maps performance for each branch or franchise location
- 💼 Pitch new clients — Show prospects their current ranking gaps to win local SEO contracts
🆚 How does this compare to other geo-grid rank trackers?
This actor provides the same geo-grid rank tracking functionality as premium tools like LocalFalcon, BrightLocal, and Local Viking — but with pay-per-scan pricing instead of monthly subscriptions. Here's a side-by-side comparison:
| Tool | Monthly Cost | Cost per 5×5 Scan | Free Tier | Geo-Grid | Competitor Analysis | HTML Report | API Access |
|---|---|---|---|---|---|---|---|
| 📍 This Actor | $0 (pay per scan) | $0.60 | ✅ $5/mo free credits | ✅ 3×3 to 9×9 | ✅ Leaderboard + Gap | ✅ Downloadable | ✅ Full REST API |
| LocalFalcon | $25–$200/mo | $1.25 | ❌ No free tier | ✅ Up to 21×21 | ❌ Extra cost | ❌ Web only | ❌ Limited |
| BrightLocal | $39–$79/mo | ~$3.00+ | ❌ Trial only | ✅ Up to 7×7 | ✅ Limited | ❌ Web only | ❌ Limited |
| Local Viking | $20–$75/mo | ~$1.50+ | ❌ No free tier | ✅ Up to 15×15 | ✅ Basic | ❌ Web only | ❌ No |
| Semrush Local | $40+/mo | ~$4.00+ | ✅ 50 credits/mo | ✅ Limited grid | ✅ Basic | ❌ Web only | ✅ Via Semrush |
| Localo | $29/mo | N/A | ✅ Free rank checker | ⚠️ Limited | ❌ No | ❌ No | ❌ No |
| Grid My Business | Varies | ~$1.00+ | ✅ Free credits | ✅ Basic | ❌ No | ❌ No | ❌ No |
Key advantages of this actor: No monthly subscription (pay only per scan), 52% cheaper than LocalFalcon per scan, downloadable self-contained HTML reports (not web-only), built-in competitor leaderboard with threat scoring and gap analysis at no extra cost, full REST API with Zapier/Make integration, and automatic trend comparison between scans.
🚀 Getting Started in 60 Seconds
You do not need a Google Place ID, exact lat/lng coordinates, or any complex setup. The actor automatically finds your business using just the basic details!
⚡ Quick Start
- Click "Try for free" to open the Apify Console.
- Fill in the 3 basic fields:
- 🏢 Business Name: e.g.,
"Joe's Pizza"- 🔍 Keyword: e.g.,
"best pizza near me"- 📍 Location: e.g.,
"Brooklyn, NY"- Click "Start"!
(The actor will automatically generate your geo-grid and HTML heatmap report).

💡 Pro tip: Schedule this actor to run daily or weekly using Apify Schedules to automatically track your ranking trends over time.
📥 Google Maps Rank Tracker input configuration
The actor accepts the following inputs. For full technical details, see the Input tab on the actor page.
| Field | Required | Default | Description |
|---|---|---|---|
businessName | ✅ | — | Your business name as shown on Google Maps |
keyword | ✅ | — | Search keyword to track (e.g., "dentist near me") |
location | ⭐ | — | Address or city name (auto-geocoded to lat/lng) |
gridSize | — | 3x3 | Grid dimensions: 3x3, 5x5, 7x7, or 9x9 |
| 📦 Bulk Scan | (Scan up to 10 businesses in one run) | ||
businesses | — | — | Array of businesses to scan — each with businessName, optional keyword and location |
| ⚙️ Advanced Settings | (Optional — skip for a quick scan) | ||
placeId | — | — | Google Place ID for exact business matching (starts with ChI) |
lat / lng | — | — | Exact coordinates (use instead of location) |
radius | — | 5 | Search radius from center (0.1–100) |
measurement | — | km | Unit: km or miles |
language | — | en | Search language (10 languages supported) |
country | — | us | 2-letter country code (e.g., in, uk, de) |
maxCompetitorsPerPoint | — | 5 | Competitors to track per grid point (1–20) |
fetchReviews | — | true | Fetch star distribution for your business |
gridSpacingKm | — | auto | Custom grid spacing in km (overrides auto-calculation) |
| 🏷️ White-Label | (Customize report branding) | ||
agencyName | — | — | Your agency/brand name for the HTML report header |
agencyLogo | — | — | URL of your agency logo for the HTML report navbar |
Example input (JSON):
Bulk scan example (multiple businesses in one run):
📤 Google Maps Rank Tracker output example
You can download the dataset in JSON, CSV, Excel, XML, or HTML format from the Output tab. The actor also generates an interactive HTML dashboard saved in the Key-Value Store.
Here's a simplified example of the JSON output for a single scan:
📌 This is a simplified example from an actual scan. The full output contains detailed data for every grid point, all competitors with contact info, and complete zone breakdowns.
trendComparisonpopulates automatically when you run multiple scans over time.
🗺️ Interactive HTML heatmap dashboard
Every scan generates a self-contained HTML report saved in the Key-Value Store as report.html. Open it in any browser — no server needed.
The dashboard includes:
- 🗺️ Interactive Leaflet.js map — Color-coded grid markers showing your rank at each point (🟢 Top 3 / 🟡 4-10 / 🔴 11-20 / ⚫ Not Found)
- 📊 Score card — Overall grade, SoLV, ARP, ATRP, and Dominance Score at a glance
- 🏆 Competitor leaderboard table — Sortable list of all competitors with head-to-head metrics
- 🧭 Zone analysis chart — Compass-based geographic performance (N/S/E/W/Center)
- 💡 Insights panel — Automated alerts and recommended actions
- 📈 Trend comparison — Side-by-side metric changes (SoLV, ARP, Score), point-level rank movements, and new/lost competitor tracking — activates automatically after your second scan
The report is designed for client presentations — print it or save as PDF directly from your browser.
💰 How much does it cost to track Google Maps rankings?
This actor uses a simple pay-per-scan model — dramatically cheaper than any monthly subscription alternative. Every Apify account gets $5 free credits/month on the Free plan, which is enough for approximately 8 full scans (5×5 grid) at no cost.
Pricing comparison: Google Maps Rank Tracker vs. alternatives
| Feature | 📍 This Actor | LocalFalcon | BrightLocal | Local Viking |
|---|---|---|---|---|
| Monthly cost | $0 (pay per scan) | $25–$200/mo | $39–$79/mo | $20–$75/mo |
| Cost per scan (5×5 grid) | $0.60 | $1.25 (PAYG) | ~$3.00+ | ~$1.50+ |
| Free tier | ✅ $5/mo free credits | ❌ None | ❌ Trial only | ❌ None |
| Grid sizes | 3×3, 5×5, 7×7, 9×9 | 3×3 to 21×21 | Up to 7×7 | Up to 15×15 |
| Competitor leaderboard | ✅ Included free | ❌ Extra cost | ✅ Limited | ✅ Basic |
| Gap analysis | ✅ Included | ❌ Not available | ❌ Not available | ❌ Not available |
| White-label reports | ✅ Custom logo + name | ❌ Not available | ❌ Not available | ❌ Not available |
| Bulk multi-location | ✅ Up to 10/run | ❌ Not available | ✅ Multi-location | ✅ Multi-location |
| Automated insights & alerts | ✅ Free | ❌ Not available | ❌ Not available | ❌ Not available |
| Trend tracking | ✅ Built-in | ✅ Available | ✅ Available | ✅ Available |
| Interactive HTML report | ✅ Downloadable | ❌ Web only | ❌ Web only | ❌ Web only |
| Full REST API access | ✅ Yes | ❌ Limited | ❌ Limited | ❌ No |
| Scheduling | ✅ Via Apify | ✅ Built-in | ✅ Built-in | ✅ Built-in |
| JSON/CSV/Excel export | ✅ Free | ✅ Included | ✅ Included | ✅ Included |
| Zapier / Make integration | ✅ Yes | ❌ No | ❌ Limited | ❌ No |
| No monthly commitment | ✅ Pay as you go | ❌ Monthly plan | ❌ Monthly plan | ❌ Monthly plan |
Estimated cost per scan
| Grid Size | Points Scanned | Cost per Scan | LocalFalcon PAYG | You Save | Status |
|---|---|---|---|---|---|
| 3×3 | 9 | $0.25 | $0.45 | 44% | ✅ Available now |
| 5×5 | 25 | $0.60 | $1.25 | 52% | ✅ Available now |
| 7×7 | 49 | $1.10 | $2.45 | 55% | ✅ Available now |
| 9×9 | 81 | $1.80 | $4.05 | 56% | ✅ Available now |
| 15×15 | 225 | ~$4.90 | $11.25 | 56% | 🔜 Coming soon |
💡 Example: Run 80+ full 5×5 scans for just $49/month — that's 80 complete client reports with competitor analysis, insights, and HTML dashboards. The same on LocalFalcon would cost $100+.
Apify gives you $5 free usage credits every month on the Free plan. That's enough for approximately 8 scans (5×5 grid) — completely free, every month!
🔗 Can I use Google Maps Rank Tracker as an API?
Yes. You can use the Apify API to run this actor programmatically from any language.
Python example:
Node.js example:
You can also integrate with Zapier, Make, Google Sheets, Slack, and more using Apify's built-in integrations.
📅 How to schedule automatic weekly scans
Automate your rank tracking by scheduling recurring scans with Apify Schedules — no coding required.
- Open Apify Console → Go to Schedules
- Click "Create new" → Select this actor (
google-maps-rank-tracker) - Set your input — Enter the same business name, keyword, and location you want to track
- Choose frequency — Select "Weekly" (recommended), "Daily", or custom cron expression
- Save and activate — Your scan will run automatically and results will appear in your dataset
💡 Tip: Combine scheduled scans with Apify Webhooks to get notified via email, Slack, or your own API when a scan completes. You can also push results to Google Sheets automatically using Apify Integrations.
❓ Frequently Asked Questions
What is Share of Local Voice (SoLV)?
SoLV measures the percentage of grid points where your business appears in the top 3 results (the Google Maps "Local Pack"). A SoLV of 72% means your business shows up in the Local Pack at 72% of the scanned locations. Higher is better — top-performing local businesses typically score 70%+.
Is this a LocalFalcon alternative?
Yes. This actor provides the same geo-grid rank tracking functionality as LocalFalcon, including SoLV scoring, grid-based heatmaps, and competitor analysis — but at a fraction of the cost. Key differences:
- No monthly subscription — Pay only for what you scan
- 52% cheaper per scan — $0.60 vs $1.25 per 5×5 grid
- $5 free Apify credits/month — Enough for ~8 free scans, no credit card required
- Full API access — Automate scans and integrate with your tools
- Downloadable HTML reports — Own your data, present it offline
- Built-in competitor analysis — Leaderboard, gap analysis, and automated insights included at no extra cost
Is this a BrightLocal alternative?
Yes. This actor provides similar Local Search Grid functionality to BrightLocal, including geo-grid rank tracking and competitor analysis. Key advantages:
- No monthly subscription — BrightLocal starts at $39/mo. This actor has no monthly fees.
- Per-scan pricing — Pay only when you run a scan, starting at $0.25
- Full API access — Run scans programmatically from Python, Node.js, or any language
- Gap analysis included — See your rating and review gap vs. the market leader
- Downloadable HTML reports — Self-contained dashboard you can share offline
Is this a Local Viking alternative?
Yes. This actor provides similar geo-grid rank tracking functionality to Local Viking with key advantages:
- No monthly subscription — Local Viking starts at $20/mo. This actor is pay-per-scan.
- Cheaper per scan — $0.60 vs ~$1.50+ per 5×5 grid
- Full REST API — Automate scans from Python, Node.js, or any language
- White-label reports — Add your agency branding directly to the HTML dashboard
- Bulk scanning — Scan up to 10 businesses in a single run
Is this a Grid My Business alternative?
Yes. Grid My Business provides basic geo-grid rank checking. This actor goes much further:
- Competitor leaderboard with threat scoring — Not just your rank, but who's beating you and where
- Gap analysis — Rating and review gap vs. the market leader
- Zone-by-zone breakdown — See which compass directions (N/S/E/W) you're strong or weak in
- Automated insights — CRITICAL / WARNING / OPPORTUNITY alerts with actionable recommendations
- Trend tracking — Compare scans over time to measure SEO progress
Can I use this Google Maps rank tracker API in Python?
Yes. Use the official apify-client PyPI package to access this actor programmatically. See the API code examples above.
How does the geo-grid ranking work?
The actor creates a grid of geographic coordinates around your business location based on the radius and grid size you specify. At each grid point, it queries Google Maps for your keyword and checks where your business appears in the results. This gives you a map of your ranking across your entire service area — not just from one location.
What are the advantages over the Google Maps API?
The official Google Maps Places API does not provide ranking data — it only returns place details. This actor uses a different approach to determine your actual position in Google Maps search results for a given keyword at specific geographic coordinates. The official API also has strict rate limits and costs $17 per 1,000 requests.
How accurate is the rank data?
The actor queries real-time Google Maps results with geographic precision (latitude/longitude + search keyword). Results reflect what a user would see when searching from that exact location at the time of the scan. Each grid point triggers an independent search to ensure location-specific accuracy.
Can I track multiple keywords?
Currently, each scan tracks one keyword at a time. To track multiple keywords (e.g., "plumber near me" AND "emergency plumber"), run separate scans for each keyword. You can automate this using Apify Schedules.
Can I scan multiple businesses at once?
Yes! Use the businesses input field to scan up to 10 businesses in a single run. Each entry needs a businessName — you can optionally override the keyword and location per business. This is ideal for agencies managing multiple clients in the same area. Each business is charged separately via PPE pricing (e.g., 5 businesses × $0.60 = $3.00 for 5×5 grids).
Can I add my agency branding to the report?
Yes. Use the agencyName and agencyLogo input fields to replace the default branding in the HTML dashboard. Your agency name appears in the report header and footer, and your logo appears in the navigation bar. This makes the report ready for client presentations without any post-processing.
How does trend tracking work?
Trend comparison activates automatically when you run 2 or more scans for the same business name and keyword combination. The actor saves a compact snapshot after each scan to a persistent named storage. On the next run, it automatically compares:
- SoLV change — Did your Local Pack presence go up (⬆️) or down (⬇️)?
- ARP change — Is your average rank position improving (📈) or declining?
- Point-level changes — How many grid points improved, declined, or stayed the same
- Competitor movement — New competitors that appeared and old ones that disappeared
- Overall score delta — Your composite score change between scans
You don't need to wait between scans — even two runs on the same day will generate a valid trend comparison. Schedule regular scans using Apify Schedules to build a ranking history over time. The interactive HTML report also includes a visual trend comparison section.
💡 Tip: The first scan always shows
trendComparison: null. Run it once more with the same business name and keyword, and you'll see the full comparison data with metric deltas, point-level changes, and competitor shifts.
What grid size should I use?
- 3×3 (9 points) — Quick overview. Good for initial testing or tight budgets. $0.25/scan
- 5×5 (25 points) — Recommended for most businesses. Provides detailed coverage. $0.60/scan
- 7×7 (49 points) — Deep analysis for competitive markets. $1.10/scan
- 9×9 (81 points) — Full coverage for maximum detail and agency reports. $1.80/scan
What is the Dominance Score?
The Dominance Score (0–100) is a composite metric that combines your Local Pack presence, overall visibility, rank quality, and geographic coverage into a single number. It's accompanied by a letter grade (A+ to F) so you can quickly assess your local SEO health at a glance.
What is Gap Analysis?
Gap Analysis compares your business against the top competitor in your area. It shows you:
- Rating gap — How your Google rating compares to the market leader
- Review gap — How many more (or fewer) reviews you have
- Category advantage — Whether you're in the same business category as your top competitors
This helps you identify exactly what to improve to overtake the competition.
Can I use this for local SEO client reporting?
Absolutely. This actor is built for local SEO agencies and consultants. Every scan generates a professional, self-contained HTML dashboard you can share with clients — no login needed, just open in a browser or save as PDF. The report includes color-coded geo-grid heatmaps, score cards, competitor tables, zone analysis, and actionable insights. Schedule automated scans with Apify Schedules to deliver weekly or monthly reports automatically.
⚖️ Is it legal to track Google Maps rankings?
This actor queries publicly available Google Maps search results — the same data any person can see by searching on Google Maps. It does not extract private user data, personal information, or data behind any login wall.
We believe this tool, when used for ethical business intelligence and SEO analysis, is safe and compliant. However, you should be aware that your results could contain publicly listed business information. If you are unsure about your use case, consult your legal team.
You can also read Apify's blog post on the legality of web scraping.
🆘 Support and feedback
- Found a bug? Report it on the Issues tab — I respond within 24 hours
- Need help? Leave a comment on the Issues tab or contact me directly
- Feature request? I'm actively developing this actor and welcome suggestions
- Need a custom solution? I can build custom Local SEO tools tailored to your needs — reach out via the Issues tab
Your feedback helps make this tool better for everyone. If you find it useful, please leave a ⭐ review!
🔑 Keywords
Google Maps rank tracker, local SEO rank checker, geo-grid rank tracker, Google Business Profile ranking tool, LocalFalcon alternative, BrightLocal alternative, Local Viking alternative, Grid My Business alternative, SoLV calculator, Share of Local Voice, local pack tracker, Google Maps position checker, local SEO heatmap, rank tracking API, local search grid, GMB rank checker, local SEO audit tool, competitor rank analysis, Google Maps SEO tool, free local rank tracker, bulk local SEO scanner, white-label SEO report, local SEO agency tool, multi-location rank tracker, Google Maps ranking automation