

npm Download Stats Scraper: Trends & Rankings
Pricing
from $0.37 / 1,000 series scrapeds
npm Download Stats Scraper: Trends & Rankings
Track npm download volume per package across day, week, month, year or a custom range. Daily series, peak days and share-of-total. No key, no proxy.
Pricing
from $0.37 / 1,000 series scrapeds
Rating
0.0
(0)
Developer

Arman Hossain
Maintained by CommunityActor stats
0
Bookmarked
1
Total users
0
Monthly active users
2 months ago
Last modified
Categories
Share
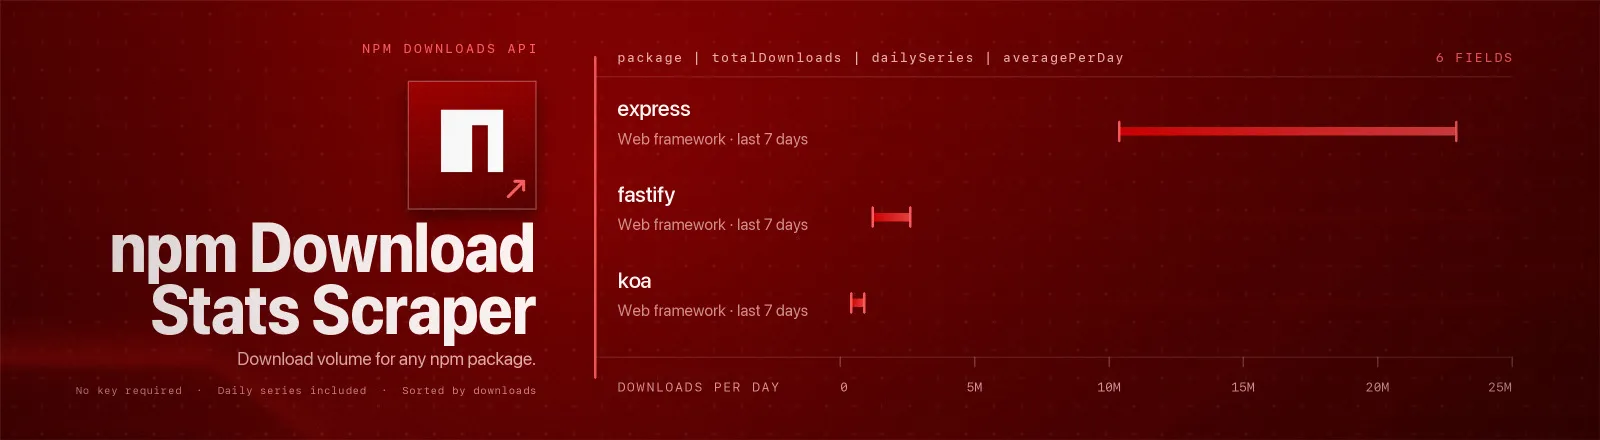
Reads download volume for any set of npm packages straight from the official npm downloads API. You get totals, a day-by-day series, average per day, peak day and each package's share of the set you asked about.
This is the counts endpoint at api.npmjs.org/downloads, not the registry, so there's no key, no login, no proxy and no browser, just JSON. Unscoped packages are batched 128 at a time, so a 500-package comparison is four HTTP requests and finishes in a couple of seconds.
Agent skill: SKILL.md
What you get
| Field | What it holds |
|---|---|
package | Package name as npm reports it |
period, granularity | The window you asked for, and whether a daily series was requested |
start, end, days | Actual window npm served, and its length in days |
totalDownloads | Downloads across the whole window |
dailySeries | [{ day, downloads }], populated when granularity is range and empty for point |
averagePerDay | totalDownloads / days, rounded |
peakDay, peakDownloads | Busiest day in the series and its count, range only |
shareOfComparisonSet | Fraction of the combined downloads of every package in the run, compareMode only |
url | npmjs.com package page |
scrapedAt | Run timestamp |
Records are sorted by totalDownloads descending, so the dataset is already a ranking. RUN_SUMMARY in the key-value store holds counts, the request count, the filters you used, and any package that returned nothing.
Use cases
- Library benchmarking. Compare your library against its alternatives in one run, with share of total included.
- Adoption inflection points. Pull a year of daily data and diff week over week.
- OSS traction reporting. Defensible numbers from the canonical source, on a schedule.
- Supply-chain and SBOM triage. Weight dependency risk by how much the ecosystem actually uses a package.
- DevRel dashboards. Feed a chart directly from the dataset, no transformation needed.
Quick start
Last month's totals for three frameworks:
A year of daily data with share of total, for a competitive chart:
An explicit window, for the release quarter you actually care about:
Input
| Field | Type | Default | Notes |
|---|---|---|---|
packages | array | required | Package names, scoped or plain. Duplicates are removed before any request. |
period | string | last-month | last-day, last-week, last-month, last-year, YYYY-MM-DD, or YYYY-MM-DD:YYYY-MM-DD. |
granularity | string | range | point for a single total, range to also get the daily series. |
compareMode | boolean | false | Fills in shareOfComparisonSet. Only meaningful with two or more packages. |
compareMode compares the packages in this run, so the share is relative to the set you passed, not to all of npm. Combine it with granularity: "point" when you only want the ranking and want the dataset small.
Output example
A real record, produced by {"packages": ["express".], "period": "last-week", "granularity": "range", "compareMode": true}:
The weekend dip visible in that series, 10.8M on Saturday against 22.9M on Tuesday, is normal for developer tooling and is exactly why range beats point for anything trend-shaped.
Choosing a period
| You want | period | granularity |
|---|---|---|
| Yesterday's number | last-day | point |
| A weekly leaderboard | last-week | point |
| A trend chart | last-year | range |
| A specific quarter | 2026-01-01:2026-03-31 | range |
| One historical day | 2026-07-01 | point |
npm keeps roughly 18 months of daily history. Ask for more and it quietly moves start forward, so check the start field on the record rather than the period you sent.
API example
JavaScript example
Limits and behaviour
- Unscoped packages are batched, scoped ones are not. npm's bulk endpoint accepts up to 128 comma-separated names but rejects anything starting with
@, so scoped packages get one request each. The Actor splits your list automatically and logs how many requests it made. - A missing package does not kill the run. Unknown names come back
nullinside a bulk response, or 404 on their own. Either way they land inRUN_SUMMARY.failuresand everything else is still saved. The Actor errors only if nothing resolved at all. - Transient errors get retried. 429 and 5xx get three attempts with linear backoff. 400 and 404 are fatal for that batch, because a malformed period will never succeed.
- Counts are downloads, not users. CI runners, mirrors and Docker builds all count. Treat the numbers as a relative signal over time, not as an installed base.
- Public data only. No authentication, no personal data, nothing that gets around access controls.
FAQ
Do I need a proxy? No. Proxy configuration is not required to run this Actor.
Do I need an npm account or token? No. You supply no credentials.
How many packages can I pass? As many as you like. Unscoped names cost one request per 128, and scoped names cost one request each. A thousand unscoped packages is eight requests.
Why is a package missing from my dataset? Either the name is wrong, or it has never been published, or it has no downloads in the window. RUN_SUMMARY.failures names it explicitly.
How far back does history go? About 18 months of daily data. Longer ranges are trimmed by npm rather than rejected, so always read start and end from the record.
Does this give me versions and dependencies too? No, that is a different npm API. Use npm Package Scraper for registry metadata.
Can I schedule it? Yes, it is designed for it. Run daily with granularity: "point" and build your own history, or weekly with range for ready-made charts.


