
EU Electricity Prices API: Day-Ahead Power Prices & Cheap Hours
Pricing
from $0.14 / 1,000 price rows
EU Electricity Prices API: Day-Ahead Power Prices & Cheap Hours
Electricity prices scraper & API: hourly (or 15-minute) day-ahead spot prices of the European electricity market (Strompreise, prix de l'électricité), 40+ bidding zones, official data — energy prices, cheapest hours, negative-price and spike alerts, history. For Home Assistant, Slack, webhooks.
Pricing
from $0.14 / 1,000 price rows
Rating
0.0
(0)
Developer

EuroScrape
Maintained by CommunityActor stats
0
Bookmarked
1
Total users
0
Monthly active users
2 days ago
Last modified
Categories
Share
EU Electricity Prices (Day-Ahead): All Zones & Cheap Hours
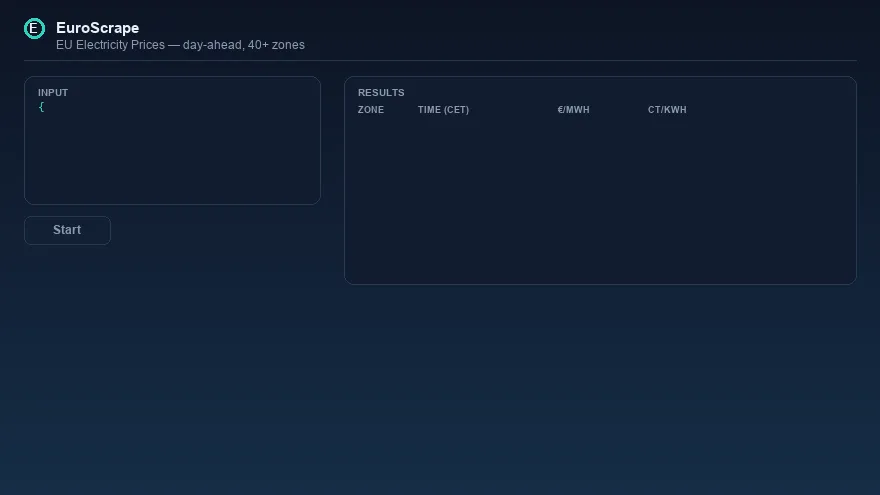
Tomorrow's electricity prices for 40+ European bidding zones — with the cheapest hours computed for you. Hourly (or native 15-minute) day-ahead spot prices from official market data, plus a free day summary per zone: the cheapest 3-hour window, negative-price intervals, min/max with their exact times.
- ⚡ Every European zone: France, Germany-Luxembourg, all 4 Swedish and 5 Norwegian zones, both Danish zones, all Italian zones, Iberia, the Baltics, the Balkans… Type a country name and get all its zones.
- 🕐 Cheapest window, of the length you need: 3 hours by default, 1 to 12 with
windowHours— the single answer smart-home and EV owners actually want: when to charge, heat or run heavy loads. - 🔔 Daily alerts: schedule it after the 13:00 CET auction and get tomorrow's summary on Telegram, Slack, Discord or a webhook (Home Assistant friendly) — with negative-price and spike alerts.
- 📜 History included: the same data goes back years, for backtesting a dynamic tariff or sizing a battery.
✨ Why this Actor
| 🌍 One input, a continent | "zones": ["all"] = every European bidding zone in one dataset, same format. |
| 🧮 Both units | Every row carries priceEurMwh and priceCtKwh — no mental division when comparing with your tariff. |
| ⏱️ Market-native resolution | The EU switched to 15-minute pricing; get hourly averages (default) or the raw quarter-hours. |
| 🆓 Summaries free | Averages, extremes with times, cheapest/priciest windows (with start and end), hours of negative prices, daily spread. |
| 🔌 Automation-ready | JSON/CSV via the Apify API, plus webhook pushes — drop it into Home Assistant, Node-RED, Make or n8n. |
🎯 Use cases
- Smart home & EV: charge in the cheapest window every night, automatically.
- Small businesses on spot tariffs: shift consumption, get spike warnings before an expensive day.
- Energy analysts & journalists: compare zones, track negative-price frequency, pull years of history in one run.
- Solar & battery owners: spot the negative-price intervals when exporting costs you money.
🚀 Examples
Today and tomorrow for France and Germany:
Tomorrow's cheap hours on Telegram, every day at 13:30 CET:
Tomorrow's cheapest 5 hours to charge an EV, pushed to Home Assistant:
A year of 15-minute history for the whole Nordics:
📦 Output
A price row (real data):
The free day summary (real data — note the solar dip: the day averages 172 € but the early-afternoon window costs less than half the evening peak):
💰 Pricing
| Event | Price |
|---|---|
| Run start | $0.003 |
| Price row (one hour, one zone) | $0.0002 |
| Day summaries | free |
A daily "France + Germany, today + tomorrow" run ≈ $0.02. A full year of hourly history for one zone ≈ $1.75. Apify subscribers pay less: −10% (Starter), −20% (Scale), −30% (Business). Set a maximum cost per run in the run options and the Actor stops cleanly when it's reached.
❓ FAQ
When is tomorrow published? The day-ahead auction clears around 12:45 CET; prices are available shortly after 13:00 CET. Schedule your daily run at 13:30 CET and you'll always catch them.
Which time zone are the times in? timeCet is market time (CET/CEST) — the clock the European power market runs on — and timeUtc is included for your automations.
Why 15 minutes? European day-ahead markets moved from hourly to 15-minute products in 2025. The default output averages them into hourly rows; set resolution: "quarter" for the native data.
Are all zones and dates in 15 minutes? No. Dates before the market switched, and a few zones such as Switzerland, are hourly. marketResolution tells you which one you got, and the windows and negative-price durations are computed on real time either way.
Is this my home tariff? It's the wholesale day-ahead price — the basis of dynamic tariffs (Tibber, aWATTar, Octopus…). Your supplier adds taxes, grid fees and margin on top; the shape of the day (cheap and expensive hours) is what this data gives you.
Where does the data come from? Official market data (Bundesnetzagentur | SMARD.de) served by the Fraunhofer ISE energy-charts.info API, licence CC BY 4.0 — the source is credited in every summary. If that API is down, the prices of Germany-Luxembourg, France, Austria, the Netherlands, Czechia, Denmark (DK1, DK2), southern Norway (NO2) and southern Sweden (SE4) are read directly from SMARD, the same data at its origin; Spain and Portugal from OMIE, the Iberian market operator; Finland, Estonia, Latvia and Lithuania from Elering, the Estonian grid operator; central Sweden (SE3) from Energinet. Each backup was checked hour by hour against a second source. The other zones wait for the API to come back.
Great Britain? GB left the EU day-ahead coupling; it's not in this dataset (the Actor tells you if you ask for it).
🔌 API, AI agents and integrations
- API: one call runs the Actor and returns the results,
POST https://api.apify.com/v2/acts/euroscrape~eu-electricity-prices/run-sync-get-dataset-items(see the API tab for Python, JavaScript and cURL). - AI agents (MCP): add
https://mcp.apify.com?tools=euroscrape/eu-electricity-pricesto Claude, Cursor, VS Code or any MCP client, and the Actor becomes a tool your agent can call. - No-code automation: start runs and pass the results on with Apify's integrations for n8n, Make and Zapier, or with a webhook when a run ends.
- Exports: every result set downloads as JSON, CSV, Excel or XML, and can be sent to Google Sheets.
⭐ Your feedback
If this Actor saves you time, a short review on Apify Store helps other users find it. Missing a zone or a statistic? Say it in your review: the most requested features are added first.
🔗 More from EuroScrape
- France Fuel Prices: Cheapest Stations Near You & Alerts: live official prices of all ~10,000 French stations — cheapest Diesel, E10, E85 or LPG around any point, with distances and price-drop alerts.
- EU Public Tenders Scraper: TED, BOAMP & Awards: open tenders and contract awards from all of Europe (TED) and France (BOAMP, DECP), with winners per lot, values in € and daily alerts.
- EU VAT Number Validator (VIES): Bulk Check, Proof & Alerts: validate VAT numbers in bulk against the EU's official registry, with consultation proof for tax audits and alerts when a customer's number becomes invalid.
- France Real Estate Sold Prices (DVF): €/m², Sales & Trends: every property sale registered by the French State — real prices, €/m², addresses, GPS, market trends per city and alerts on new sales.
- France Energy Ratings (DPE): Homes, Energy Sieves & Alerts: official energy certificates of French homes — class, address, consumption, yearly bill — with the F/G energy sieves of any city and alerts on new certificates.
- France Building Permits (Sitadel): Projects, Builders & Alerts: official register of French building permits — housing programmes and commercial buildings with the developer (name, SIREN), address, size and status, and alerts when works start.
- Google Flights Scraper: Cheapest Dates, Prices & Price History: flight prices for any route and dates, cheapest day to fly, typical price range and price-drop alerts.
- Ryanair Low Fare Finder: Cheapest Days, Anywhere & Alerts: Ryanair fare calendars months ahead, every destination under your price cap from any airport, and alerts on drops and new deals.
- Google Hotels Scraper: Prices from Every Booking Site: hotel prices for any destination and dates, with the price on every booking site, rate parity, price calendars and alerts.
- Vinted Scraper: 26 Countries, Deals, Alerts & Seller Data: search Vinted across 26 countries, prices with buyer fees, seller ratings and instant alerts on new listings.
- EU Second-Hand Marketplaces Scraper: Vinted, OLX & More: one search on the top second-hand marketplaces of 18 European countries, prices in €, cheapest country and resale margin.
- Kleinanzeigen Scraper: Deal Finder & Price-Drop Alerts: German classifieds with view counts, full seller details and instant alerts.
- Website Tech Stack Detector: 280+ Technologies, Leads & Signals: technologies, company identity, contacts and sales signals for any website.
- French Companies Scraper (SIRENE): every French company by activity, area and size, with verified websites and emails.
- UK Companies House Scraper: UK companies by SIC code and location, with directors, websites and emails.
- App Store Reviews Scraper + Google Play Reviews: reviews from both stores in 58 countries, rating by version and country, alerts on new negative reviews.
- Impressum & Legal Notice Scraper (EU): legal identity, registry numbers and VAT IDs from any website, registry-verified.


