
Airbnb Occupancy & Revenue - Short Term Rental Data, AirDNA Alt
Pricing
from $2.50 / 1,000 airbnb occupancy & revenues
Airbnb Occupancy & Revenue - Short Term Rental Data, AirDNA Alt
Airbnb occupancy rate and revenue calculator for any market: occupancy, ADR, RevPAR and 30/90/365-day revenue for every listing, from the live calendar. A pay-per-use AirDNA alternative for short-term rental investors.
Pricing
from $2.50 / 1,000 airbnb occupancy & revenues
Rating
0.0
(0)
Developer

Mayowa Ogedengbe
Maintained by CommunityActor stats
0
Bookmarked
1
Total users
1
Monthly active users
2 days ago
Last modified
Categories
Share
Airbnb Occupancy & Revenue Estimator
Thinking about buying a short-term rental? Before you do, you want two numbers: how often places like it get booked, and what they earn. Type a town, and this Actor gives you every Airbnb listing there with its nightly rate, occupancy and estimated revenue, for the next 30 and 90 days and the year ahead.
No Airbnb account, no login, no monthly subscription. You pay per listing, so a 100-listing town costs about $1.
▶ Watch the 85-second walkthrough
Why people use it
- 🏡 Size up a market before you buy. See what comparable homes charge and how full their calendars are.
- 📊 Per-listing numbers, not just a city average. Nightly rate (ADR), occupancy %, RevPAR and revenue for every listing, so you can filter by bedrooms, price or rating yourself.
- 🔁 Gets sharper every week. Re-run the same town on a schedule and nights booked between runs show up as confirmed bookings.
- 📁 Your data, your spreadsheet. Export to Excel, CSV or JSON, or pull it into your own model.
- 💸 Pay per use. No subscription: $0.01 per listing with occupancy on the Free plan, less on paid plans.
Quick start (2 minutes)
- Under Locations to search, click + Add and type a town, for example
Gatlinburg, Tennessee. Add more lines for more towns. - Set Max listings per location, for example
100. - Estimate occupancy & revenue is already switched on (under Enrichment). Press Start.
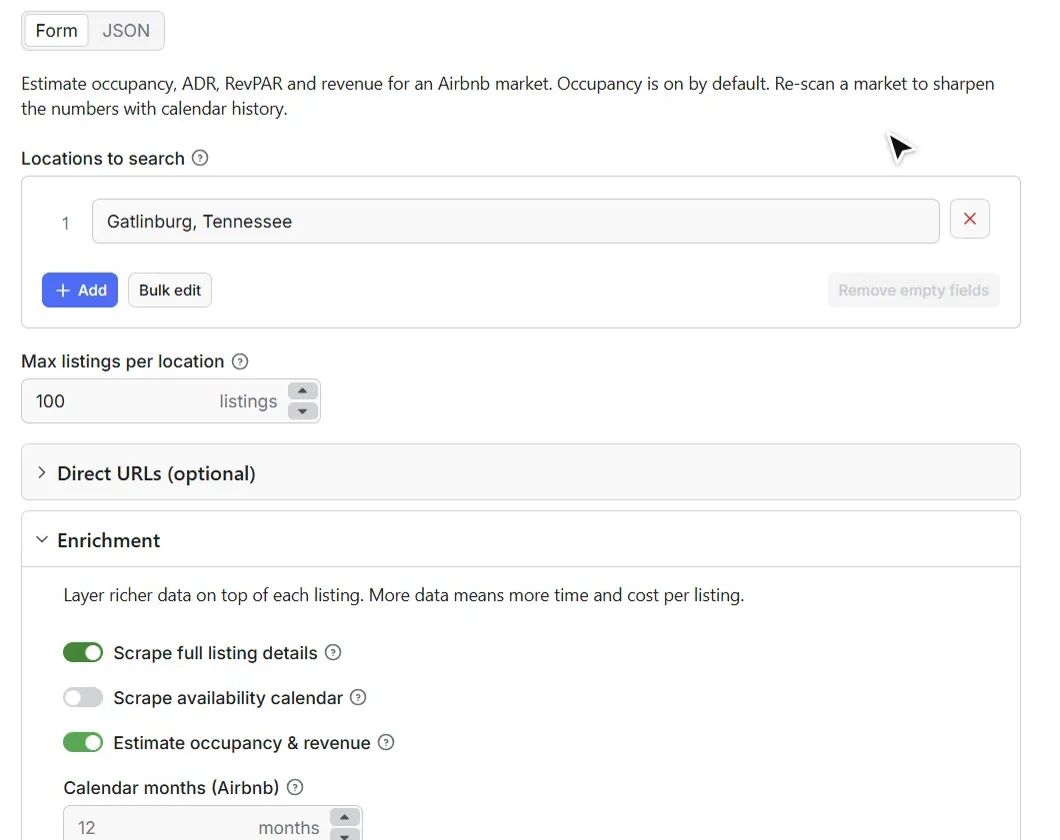
About two minutes later you have one row per listing. Open the Occupancy & revenue tab for a ready-made table:
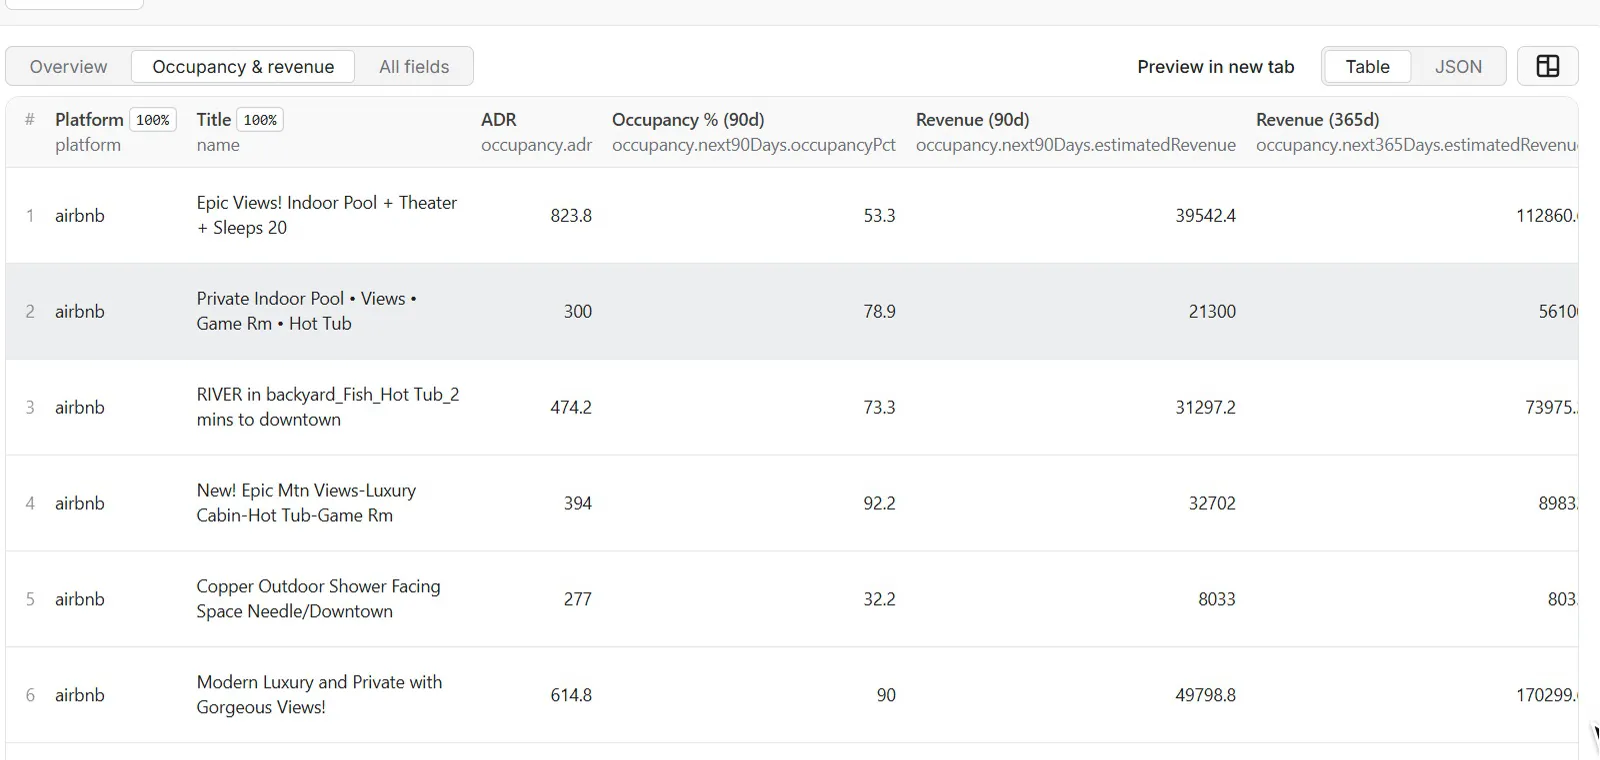
Real example: Gatlinburg, Tennessee (run on 17 October 2026, 100 listings)
| Listing | Bedrooms | Nightly rate | Booked, next 30 days | Booked, next 90 days | Est. revenue, next 90 days |
|---|---|---|---|---|---|
| Modern Luxury and Private with Gorgeous Views! | 2 | $615 | 90% | 90% | $49,799 |
| Epic Views! Indoor Pool + Theater + Sleeps 20 | 6 | $824 | 53% | 53% | $39,542 |
| Private Indoor Pool • Views • Game Rm • Hot Tub | 3 | $300 | 77% | 79% | $21,300 |
| The Quiet Lily | 1 | $233 | 93% | 84% | $17,738 |
| Gt-502 D/town by Anakeesta | 2 | $139 | 47% | 44% | $5,560 |
Across all 100 listings, the typical (median) nightly rate was $312.
Keep it fresh: run it weekly
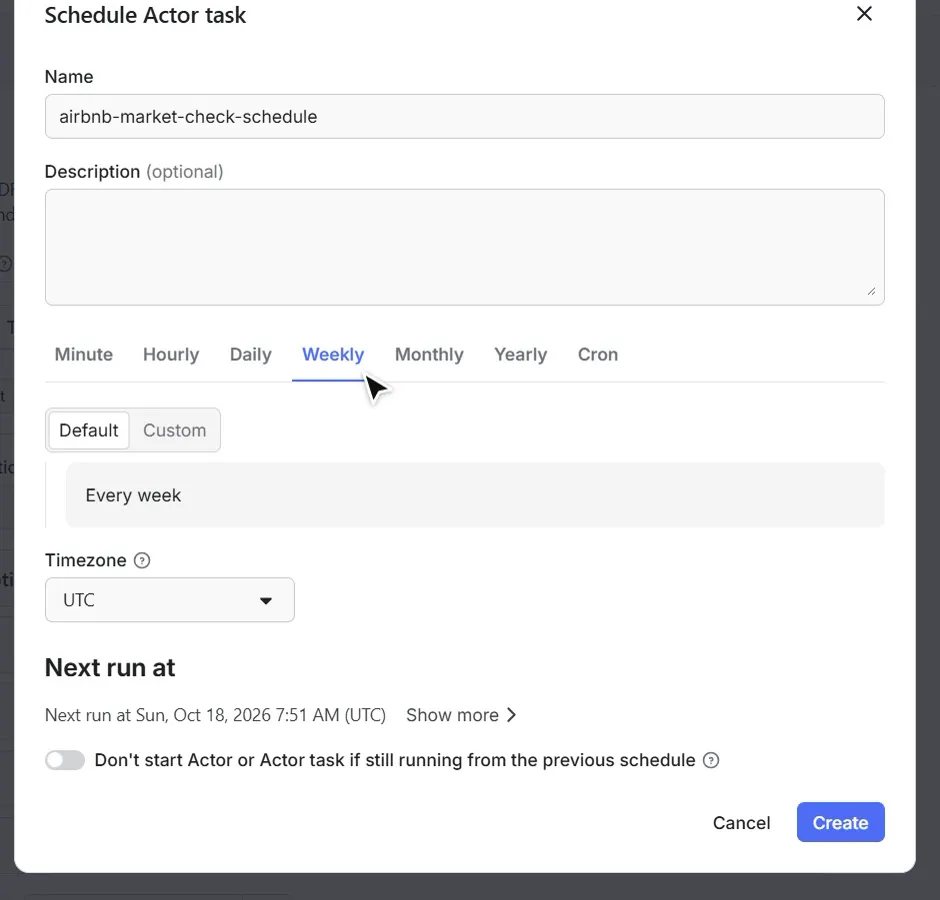
Click Schedule on your saved task, pick Weekly, and you're done. Every run checks each listing's calendar again. A night that was open last week and is taken now is a real booking, and it is counted in the confirmed fields. The longer a town is tracked, the more of its numbers are confirmed rather than estimated.
What you get for each listing
| Group | Fields |
|---|---|
| Performance | nightly rate (ADR), occupancy %, RevPAR and estimated revenue for the next 30 days, 90 days and 365 days |
| Confirmed | booked nights and host-blocked nights once a town has been tracked for a while |
| Listing | name, property type, bedrooms, beds, baths, price shown on Airbnb, rating, reviews, Superhost, coordinates |
| Host & house | host name, response rate, years hosting, amenities, house rules, description, photos |
| Calendar | day-by-day availability and minimum stay, about a year ahead |
Settings
| Setting | What it does | Default |
|---|---|---|
| Locations to search | One town, city or area per line | — |
| Max listings per location | How many listings to get for each location | 50 |
| Direct URLs (optional) | Paste Airbnb room links (airbnb.com/rooms/...) to check specific homes | — |
| Estimate occupancy & revenue | Adds the performance numbers above | On |
| Scrape full listing details | Adds amenities, host, house rules, description and photos | On |
| Currency | USD, EUR, GBP, CAD, AUD, MXN, BRL, JPY, INR or AED | USD |
Big cities are covered in full, past the cap Airbnb puts on a single search.
Pricing
You only pay for listings you get. Prices drop on higher Apify plans.
| What | Free plan | Gold plan and above |
|---|---|---|
| Listing | $0.004 | $0.002 |
| Occupancy & revenue for that listing | $0.006 | $0.0025 |
What that looks like on the Free plan:
- One town, 100 listings with occupancy: about $1.
- Three towns, 300 listings each, tracked weekly: 900 × $0.01 × 4 runs ≈ $36 a month.
- A quick look without occupancy: 100 listings ≈ $0.40.
Apify's free monthly credit covers a small town to try it.
How the estimate works (the honest version)
A calendar shows that a night is taken, but not why: a guest booked it, or the host blocked it.
- First run: every night that isn't open counts as booked. This is the standard way to read a public calendar, and it can run high for hosts who block a lot of dates.
- Nights the host hasn't opened yet (beyond their booking window) are left out, so they don't inflate the
numbers. You can see how many in
nightsNotYetOpen. - Weekly runs: nights that go from open to taken between runs are counted as confirmed bookings.
- Nightly rate is the price Airbnb shows for a short stay, divided by its number of nights.
Good to know
- Listings you add by URL get a nightly rate from a price quote for their first open dates.
- A room link that no longer exists is listed as
listing_not_foundand isn't charged. - Running with no location returns a small sample (5 listings in Austin, Texas) so you can see the output.
- Only public information that anyone can see on Airbnb is collected. No login or cookies are used.
Use it from your own tools
- n8n: add the Apify node → Run an Actor and get dataset, choose this Actor and your input, and send the rows to Google Sheets, Airtable or email.
- Make / Zapier: use the Apify app's Run Actor action on a schedule.
- API: start a run and get the rows back in one call. Replace
YOUR_TOKENwith your Apify API token.
It also works as a tool for AI agents through the Apify MCP server.
FAQ
Is this an AirDNA alternative?
It gives you the same core numbers (occupancy, ADR, RevPAR, revenue) for any town, pay-per-use instead of a monthly subscription, and you keep the raw data per listing.
How accurate is it?
The first run is an estimate (see How the estimate works). Run the same town weekly and more of the numbers become confirmed bookings.
Do I need an Airbnb account or API key?
No. You only need an Apify account.
Can I check one specific property?
Yes. Paste its Airbnb link under Direct URLs (optional).
Related tools
- Airbnb Scraper: every listing in a city with prices, amenities, host details and the availability calendar.
- Vrbo Scraper: the same for Vrbo.
- Airbnb & Vrbo Scraper: both platforms in one run.
Questions, or a town that doesn't work? Open the Issues tab and we'll take a look.


