

Singapore Air Quality, PSI, UV & Dengue Alerts
Pricing
from $0.0005 / reading returned
Singapore Air Quality, PSI, UV & Dengue Alerts
Live Singapore environmental data in one Actor (official NEA feeds): PSI & PM2.5 by region with health bands, UV index, and active dengue clusters with case counts and location. Schedule it for alerts. No setup.
Pricing
from $0.0005 / reading returned
Rating
0.0
(0)
Developer

hiper soft
Maintained by CommunityActor stats
0
Bookmarked
2
Total users
1
Monthly active users
a month ago
Last modified
Categories
Share
Live Singapore environmental data in one Actor — pulled from the official NEA real-time feeds on data.gov.sg. Get PSI and PM2.5 by region (with health bands), the national UV index, and every active dengue cluster (case counts + location) — as clean JSON, CSV or Excel. Schedule it to power alerts, dashboards and monitoring. No key, no login.
Great for facilities & construction, outdoor/events, health analytics, travel and smart-city apps.
What you get
- 🌫️ PSI — 24h PSI per region (west/east/central/south/north/national) + health band, and the pollutant sub-indices (PM2.5, PM10, O₃, NO₂, SO₂, CO)
- 😷 PM2.5 — 1-hour PM2.5 per region
- ☀️ UV index — latest national UV reading + band
- 🦟 Dengue clusters — active clusters with locality, total case size, breakdown (homes / public places / construction sites) and centroid coordinates
- 🧾 Provenance —
feed,timestamp,sourceUrl,collectedAton every row - ⏱️ Monitor-friendly — schedule it and each run appends a timestamped snapshot
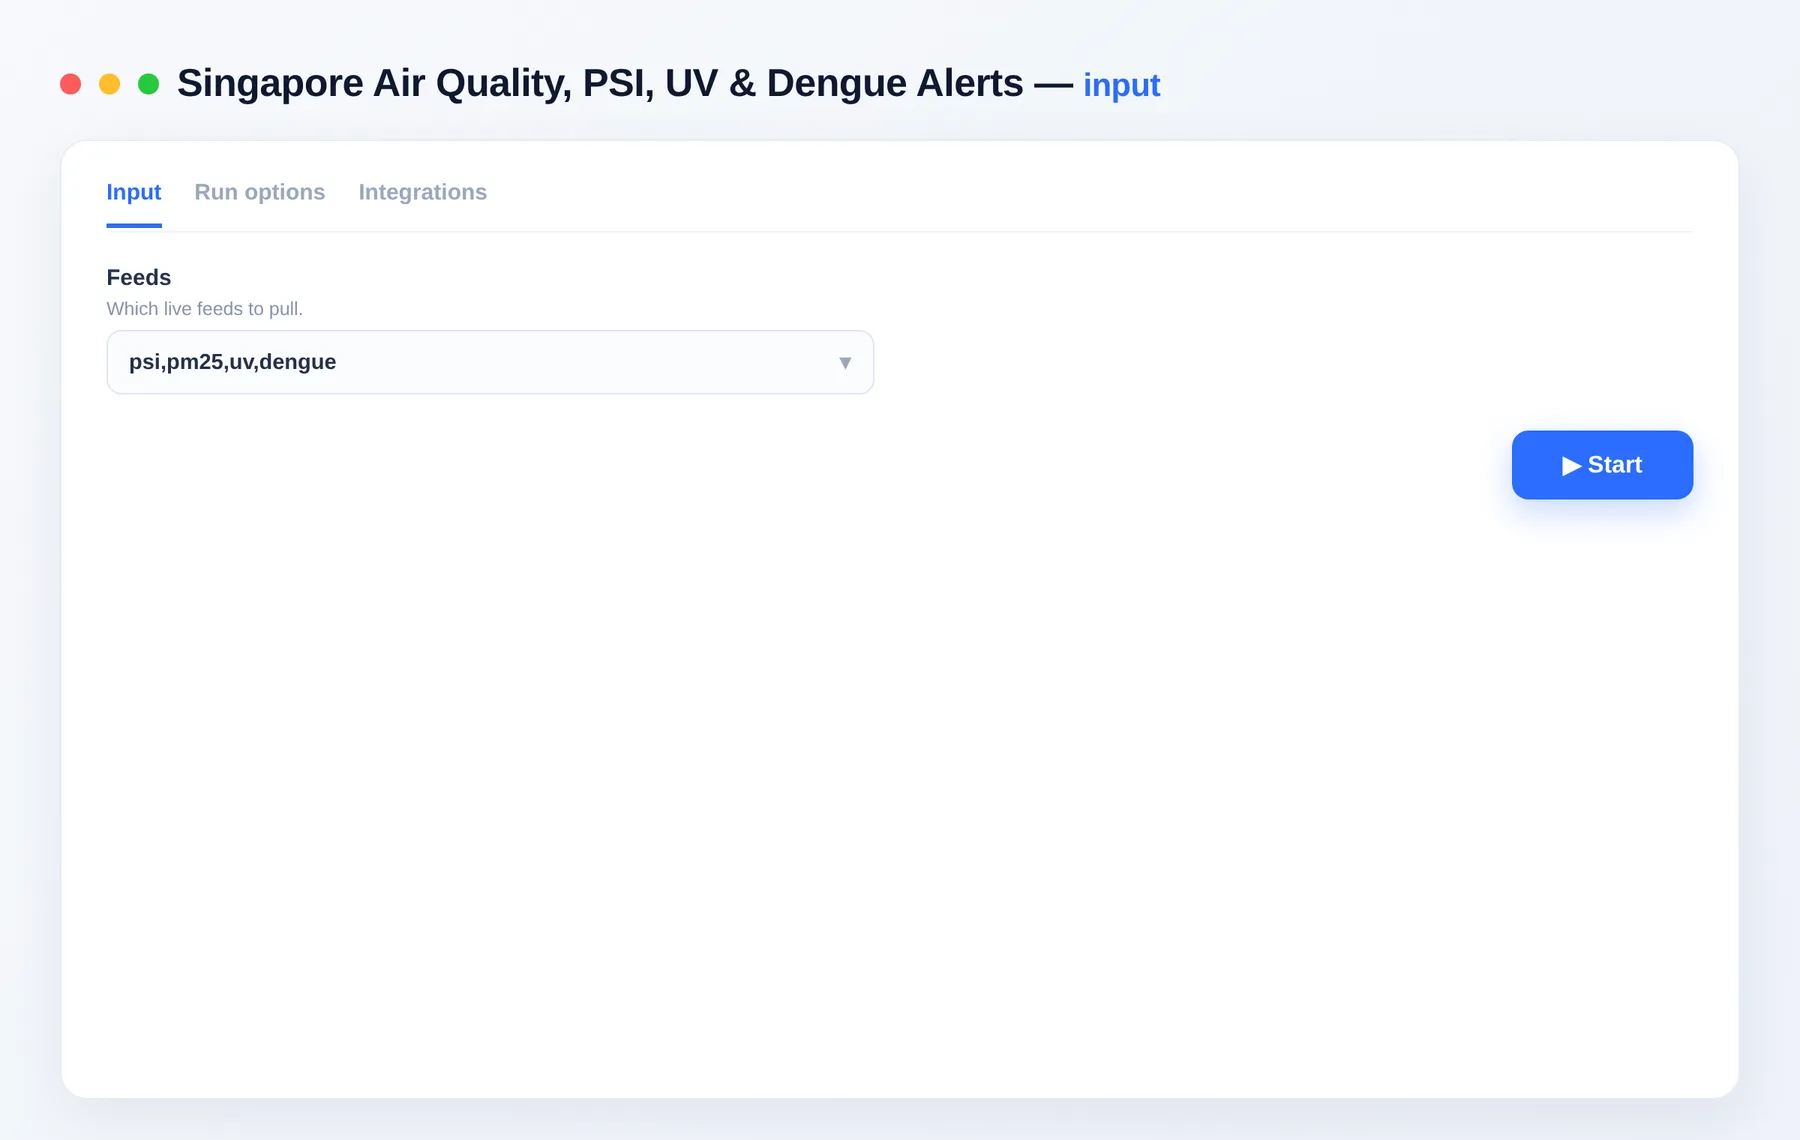
Example input
Pick any subset of feeds.
Output
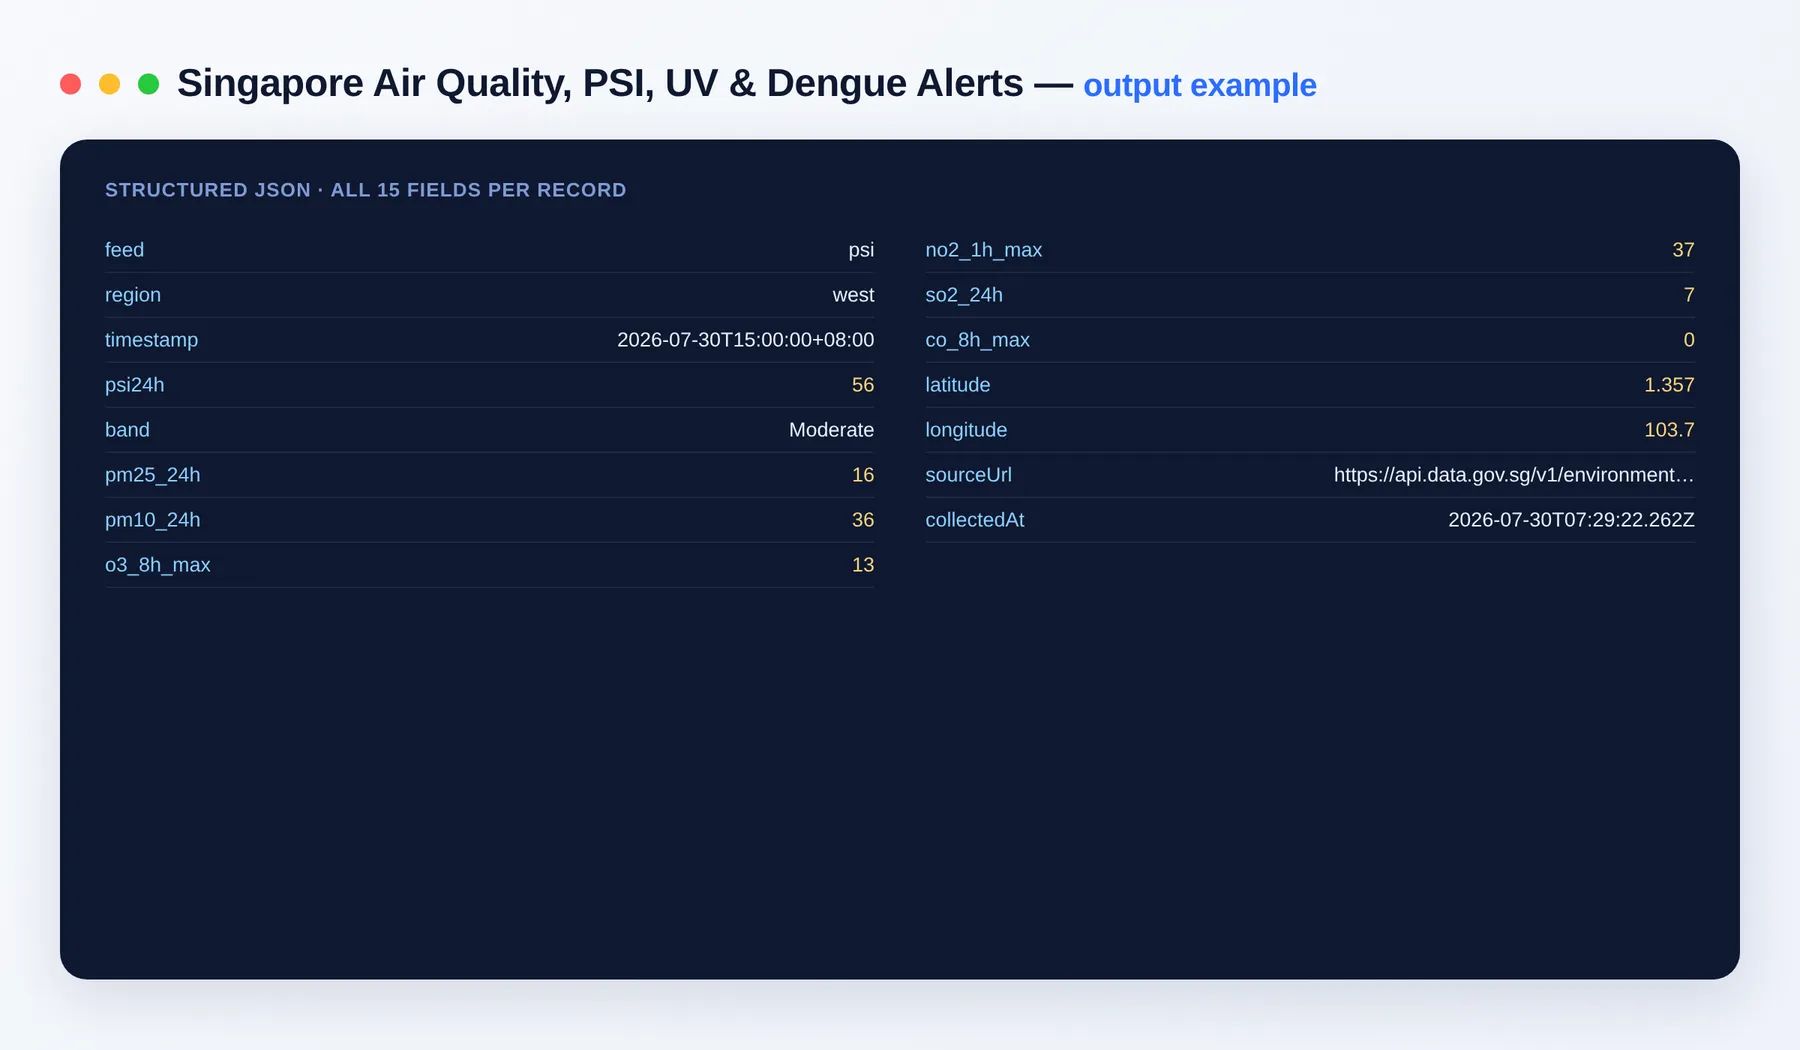
Output schema
Each row carries a feed field; the other fields depend on which feed produced the row.
| Field | Type | Description |
|---|---|---|
feed | string | Which feed the row came from: psi, pm25, uv, or dengue. |
region | string | Region the reading covers (west/east/central/south/north/national). |
timestamp | string (ISO date) | Reading time reported by the source feed. |
psi24h | integer | 24-hour PSI value (psi feed). |
band | string | Health band label for the reading (psi and uv feeds). |
pm25_24h | integer | 24-hour PM2.5 concentration (psi feed). |
pm10_24h | integer | 24-hour PM10 concentration (psi feed). |
o3_8h_max | integer | 8-hour maximum ozone sub-index (psi feed). |
no2_1h_max | integer | 1-hour maximum nitrogen dioxide sub-index (psi feed). |
so2_24h | integer | 24-hour sulphur dioxide sub-index (psi feed). |
co_8h_max | integer | 8-hour maximum carbon monoxide sub-index (psi feed). |
pm25_1h | integer | 1-hour PM2.5 concentration (pm25 feed). |
uvIndex | number | Latest national UV index value (uv feed). |
id | string | Cluster identifier (dengue feed). |
locality | string | Cluster locality name (dengue feed). |
caseSize | integer | Total cases in the cluster (dengue feed). |
casesInHomes | integer | Cases at residential premises (dengue feed). |
casesInPublicPlaces | integer | Cases at public places (dengue feed). |
casesInConstructionSites | integer | Cases at construction sites (dengue feed). |
latitude | number | Latitude for the region or dengue cluster centroid. |
longitude | number | Longitude for the region or dengue cluster centroid. |
sourceUrl | string (URL) | Official data.gov.sg feed the row was pulled from. |
collectedAt | string (ISO date) | When this Actor collected the reading. |
Input fields
| Field | Description |
|---|---|
feeds | Any of psi, pm25, uv, dengue (default all). |
FAQ
How current is it?
The NEA feeds update in near real time; timestamp is the reading time and collectedAt is your pull time.
What are the PSI bands? Good (0–50), Moderate (51–100), Unhealthy (101–200), Very Unhealthy (201–300), Hazardous (300+).
Can I get alerts? Schedule the Actor and compare each snapshot — e.g. notify when PSI enters "Unhealthy" or a new dengue cluster appears.
How does billing work? A tiny per-feed fetch charge plus pay per reading returned.
Can I integrate this with other tools? The Singapore Environment Scraper can be connected with almost any cloud service or web app thanks to integrations on the Apify platform. It works with Make, Zapier, Slack, Airbyte, GitHub, Google Drive and many more, plus the Apify API, JavaScript/Python clients and MCP. Or use webhooks to trigger an action whenever a run finishes.
Related Actors
- Singapore Carpark Availability (Live)
- Singapore Hawker Centres & Closures
- Singapore Childcare & Preschool Directory
Notes
Original clean-room implementation using Singapore's official NEA open data (data.gov.sg), reused under the Singapore Open Data Licence. Not affiliated with or endorsed by NEA or the Singapore Government.


