Apify Store Market Scanner
Pricing
from $2.00 / 1,000 results
Apify Store Market Scanner
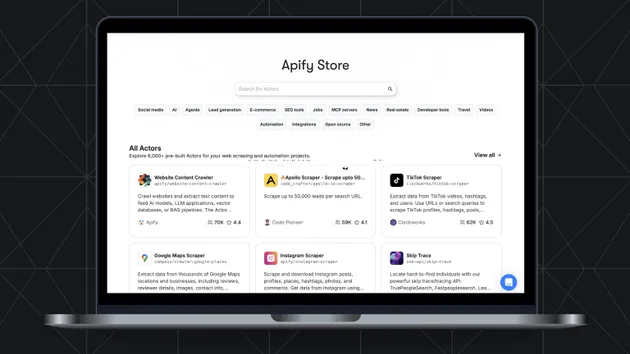
Turn the whole Apify Store into a structured dataset with growth & opportunity metrics: rising actors, category concentration, and realistic expectations for new publishers.
Pricing
from $2.00 / 1,000 results
Rating
0.0
(0)
Developer

Ziv L
Maintained by CommunityActor stats
0
Bookmarked
2
Total users
1
Monthly active users
3 months ago
Last modified
Categories
Share
Turn the whole Apify Store into a structured dataset with opportunity metrics — so you can decide what to build with data instead of vibes.
Point it at the Store (optionally filtered by category or keyword) and it collects every listed actor with usage, growth, pricing, and review stats, computes per-actor opportunity metrics, and produces a market summary: which actors are rising right now, how concentrated each category is, and what a realistic first month looks like for a new publisher.
Why this exists
Before building anything, I scanned 15,000 actors by hand to answer one question: where is real, active demand? That study produced findings like:
- ~97% of actors get runs every month — the ecosystem is alive — but only ~30% gain 5+ new users per month.
- For small actors (10–200 total users), median new users per month is 3–7, in every category. Category choice barely changes what a newcomer gets.
- The fastest-rising actors are overwhelmingly data pipelines for well-known platforms, not clever niche tools.
This actor is that study, productized: the same collection and analysis, repeatable in one click, always current.
Input
| Field | Default | What it does |
|---|---|---|
search | — | Keyword filter, same as the Store search box |
category | — | Store category (e.g. SOCIAL_MEDIA, LEAD_GENERATION, AI, MCP_SERVERS) |
sortBy | popularity | popularity = top of the market first; newest = recent launches first |
maxItems | 5000 | How many actors to collect |
riserMinGrowthPercent | 30 | Riser flag: 30-day new users ≥ this % of all-time users |
riserMinNewUsers30d | 10 | Riser flag: minimum absolute 30-day new users |
Output
Dataset — one record per actor:
- Identity:
title,name,username,url,description,categories,pricingModel - Usage:
totalUsers,users7d/30d/90d,totalRuns,runs30d,succeeded30d,lastRunStartedAt - Reputation:
reviewCount,reviewRating,bookmarks - Computed:
successRate30d,growthShare30d(30-day users ÷ all-time users),runsPerNewUser30d,isRiser
Key-value store SUMMARY — the market report:
categoryStats: per category — actor count, total 30-day runs, top-actor concentration share, and median runs / new users for small players (your realistic first-month expectation)risersTop25: the fastest-growing actors right nowriserTitleKeywords: what the rising actors call themselvespricingModelDistribution
Honest limitations
- The public Store API stops paging around offset 15,000 — with
popularitysort you get the most active ~15k actors, not the long tail. Usecategoryfilters to fully cover a segment. - The riser flag naturally includes recently launched actors (a new actor's 30-day share is high by definition); the absolute-users threshold filters pure noise but not this bias.
runsPerNewUser30dreflects heavy use by existing users, not retention.- The API exposes no creation date, so "time to traction" can't be computed.
Typical uses
- Pick a niche with evidence: demand volume vs. concentration per category.
- Sanity-check your expectations before publishing an actor.
- Track who is rising this month and what they're building.
- Feed the dataset into your own analysis or LLM research pipeline.