

US Airport-Pair Fares & Route Traffic — DOT DB1B Benchmarks
Pricing
from $33.50 / 1,000 fare records
US Airport-Pair Fares & Route Traffic — DOT DB1B Benchmarks
Look up a US airport-pair route (JFK-LAX), an airport or a city: DOT's quarterly average fare, passengers per day, distance and top/low-fare carrier shares. Historical averages, not bookable fares. Covers markets touching multi-airport cities (17 in 2026 Q1). Pay per record.
Pricing
from $33.50 / 1,000 fare records
Rating
0.0
(0)
Developer
NexGen Signal
Maintained by CommunityActor stats
0
Bookmarked
2
Total users
1
Monthly active users
20 days ago
Last modified
Categories
Share
Official source. No API key. Pay per record.
Who this is for and the decision it supports
Airline network planners, travel-analytics and pricing teams benchmarking average fares and traffic on US city-pair markets (US DOT DB1B).
One record answers: for this origin-destination market and quarter, what were the average fare, traffic and the largest/lowest-fare carrier shares — a route-economics and competitive benchmark.
Buyers usually search for this as "airfare data by route" or "db1b fares".
Sample output
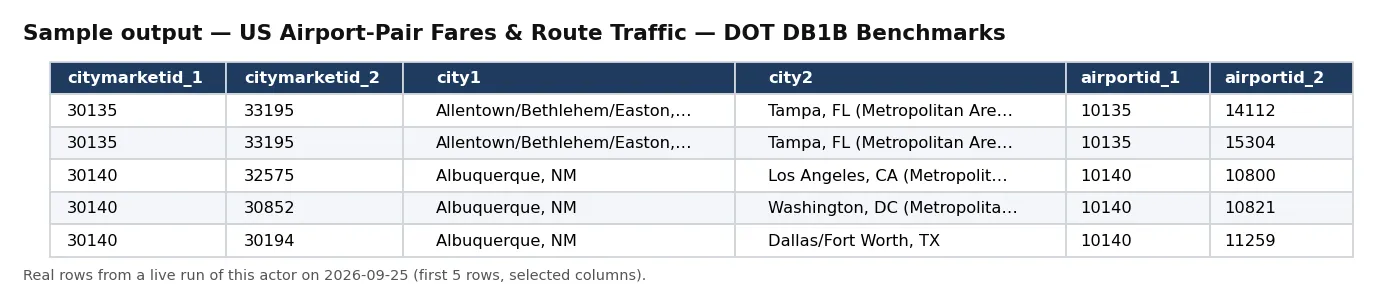
Real rows from a live run of this actor (first 5 rows, selected columns).
One full record from the same run, exactly as delivered:
What one record is
Each record is one DB1B city-pair market x quarter: city and airport ids, distance, passengers, average fare, and largest/lowest-fare carrier and their market shares and fares.
Your first run
Paste this input and run it — the last 10 quarters of the New York JFK – Los Angeles LAX market:
Here is the first record that input returned when checked (Sep 2026; newest quarter first):
fare is DOT's overall average fare (US dollars) for the quarter, with the largest carrier's and the lowest-fare carrier's averages and market shares; passengers is passengers per day. These are published historical averages, not bookable or current prices.
DOT aggregates these as directionless markets: traffic in both directions is added together and each pair is listed once per quarter, in one fixed order (here LAX first), so JFK-LAX and LAX-JFK return the same rows.
Coverage limit (from DOT): this table only lists airport markets where the origin or destination airport shares its city market with another commercial airport. In 2026 Q1 that meant 2,080 markets touching 17 multi-airport city markets: Boston, Chicago, Cleveland, Columbus, Dallas/Fort Worth, Denver, Houston, Los Angeles, Miami, New York, Norfolk, Phoenix, San Francisco, Seattle, Spokane, Tampa and Washington (checked: every row has at least one such end). A route with neither end in one of them is not in this table; a search for it returns nothing and costs nothing. Other searches: {"airports": ["SEA"], "year": "2026"} for every Seattle market in 2026; {"cities": ["Seattle"], "airports": ["JFK"]} for JFK to any airport in the Seattle market.
What the sample costs: $0.05 per record. The sample above delivers 10 records, so it costs at most $0.50.
Pulling in bulk
Raise Maximum records to pull the full historical panel of US city-pair markets. A buyer pulls the full multi-decade panel to model fare trends, market concentration and route economics.
To expand from the sample: raise Maximum records, and widen any filters shown in the input. You are billed only for records actually delivered, so a sample stays cheap and a full pull is predictable.
When to run it again
US DOT publishes DB1B quarterly; the actor returns the full series (earliest quarters first).
Update schedule: Quarterly — US DOT releases DB1B each quarter with a lag. Verified live: records carry year and quarter; the source is the official DB1B market table.
How this is different
US airport-PAIR (route/market) fares and traffic — distinct from the country-level EU Air Passenger Flow actor. This is route-level economics.
Limitations (source coverage vs product coverage)
- ROUTE/MARKET level (city-pair), and fares are AVERAGE market fares over a quarter — not bookable, current, or itinerary-level prices.
- By default the newest available quarter is returned first (currently 2026 Q1). Use the year (and optional quarter) inputs for a historical window; the full multi-decade panel back to 1993 stays reachable. Each record is one market-quarter, unique on the source key (tbl1apk).
- Excludes some ticket types per DB1B methodology.
- Table 1a only covers airport markets where the origin or destination airport shares its city market with another commercial airport (DOT's own scope note; 17 such city markets in 2026 Q1, e.g. New York, Chicago, Los Angeles, San Francisco, Washington, Seattle SEA/BFI).
FAQ
Are these current bookable fares?
No. They are quarterly average market fares from US DOT DB1B, historical by design.
Can I pull only the latest quarter?
Yes. Leave year blank for the newest quarter first; set year (and optional quarter) for a historical window, e.g. year=1993, quarter=1. An unavailable period returns an honest empty result.
Route or country level?
Route/market (city-pair) level.
How much does it cost? You pay $0.05 per fare record delivered to your dataset (less on higher Apify plans). Set the record limit in the input to cap what a run can cost. Records that are not delivered are never charged.
How do I get the data out? Every run saves its records to an Apify dataset. You can download it as JSON, CSV, Excel, XML or HTML from the run page, or read it through the Apify API.
Can I run it on a schedule? Yes. Use Apify Schedules to run it daily, weekly or monthly, with the same input each time.
Can I call it from my own code? Yes. Call nexgensignal/us-airport-pair-fare-records through the Apify API or the Apify Python and JavaScript clients, pass the same JSON input as the form, and read the dataset when the run finishes.
What happens if the source is down? The run ends with a clear status message, and nothing is charged for records that were not delivered.
Input fields
Every input this actor accepts, read from its input schema:
| Field | Type | Default | Description |
|---|---|---|---|
airportPairs | array | Airport pairs like JFK-LAX; either order matches (DOT lists each pair once). | |
airports | array | 3-character airport codes as DOT publishes them; matches either end of the market. | |
cities | array | Text in DOT's city-market name at either end, e.g. Seattle. | |
maxRecords | integer | 10 | Maximum records delivered and billed. You are billed only for records actually delivered. Raise it to pull the full set. |
year | string | Leave blank for the latest available quarter first. Set a 4-digit year (e.g. 2026) for a historical window. | |
quarter | string | Optional quarter within the chosen year. |
Default changed on 30 Sep 2026: if you leave maxRecords out, a run now returns up to 10 records (it was 500). Set maxRecords yourself to get more — the maximum is unchanged.
Output fields
Every field in each delivered record, read from its output schema:
| Field | Type | Meaning |
|---|---|---|
record_id | string | Composite source-native key. |
tbl | string | Source table id, verbatim. |
year | number | Year of the quarterly market observation. |
quarter | number | Calendar quarter (1-4). |
citymarketid_1 | number | DOT city-market id, endpoint 1. |
citymarketid_2 | number | DOT city-market id, endpoint 2. |
city1 | string | City-market name, endpoint 1. |
city2 | string | City-market name, endpoint 2. |
airportid_1 | number | DOT airport id, endpoint 1. |
airportid_2 | number | DOT airport id, endpoint 2. |
airport_1 | string | Airport code, endpoint 1. |
airport_2 | string | Airport code, endpoint 2. |
nsmiles | number | Non-stop market distance in statute miles. |
passengers | number | Average daily passengers in the market. |
fare | number | Average market fare (USD). |
carrier_lg | string | Carrier with the largest market share (code). |
large_ms | number | Largest-carrier market share (fraction). |
fare_lg | number | Average fare of the largest carrier (USD). |
carrier_low | string | Lowest-fare carrier (code). |
lf_ms | number | Lowest-fare carrier market share (fraction). |
fare_low | number | Lowest carrier fare (USD). |
tbl1apk | string | Source-native primary key for the market-quarter row. |
source | string | Data source. |
source_dataset | string | Socrata resource id. |
licence | string | Licence / public-domain notice. |
attribution | string | Required attribution string. |
caveat | string | Interpretation caveat. |
observed_at | string | UTC timestamp the record was retrieved. |
Related actors
- eu-air-passenger-flow-records — country-level EU air passenger volumes
- company-data-enrichment-api — resolve carriers to legal entities
- world-bank-project-records — transport-sector development projects
Source, licence and how it is built
Source and licence are carried on every record (source, licence, attribution, observed_at). The actor reads only the official public endpoint, honours the source's robots and licence terms, and emits values unmodified with full provenance. Records are keyed on a stable id so re-runs upsert cleanly into a table you keep. Row delivery and billing are exactly equal: you are charged once per record delivered (push-then-charge), so an empty run costs nothing.
Part of NexGen Signal — official-source data products.


